


A project management dashboard is one of the essential tools for delivering projects as planned. That’s because a project dashboard is a visual representation of key performance indicators (KPIs) that provide a high-level overview of key project metrics. For those not ready to upgrade to project management software, there’s an alternative: Excel dashboard templates.
Dashboard templates are designed to track a variety of different metrics that provide vital data for project managers and their teams. We have free dashboard templates that will help track budget, workload, progress and more. Monitoring this allows project managers to determine if the project is on schedule and not overspending. If it is, adjustments can be made to get back on track before it impacts the success of the project.
Download these Excel dashboard templates for free or sign up for a free 30-day trial of our software and see what real-time dashboards can do when managing a project, program or portfolio. We’ll talk more about that later, but first, let’s get to the Excel dashboard templates for free download.
Excel dashboard templates are important for a high-level overview of the project. This free project dashboard template for Excel is an excellent choice. It allows project managers and their teams to monitor project progress on several different bar charts and pie charts. Four dashboards together paint a clear picture of the project and where it stands concerning where it should be in terms of the project plan.
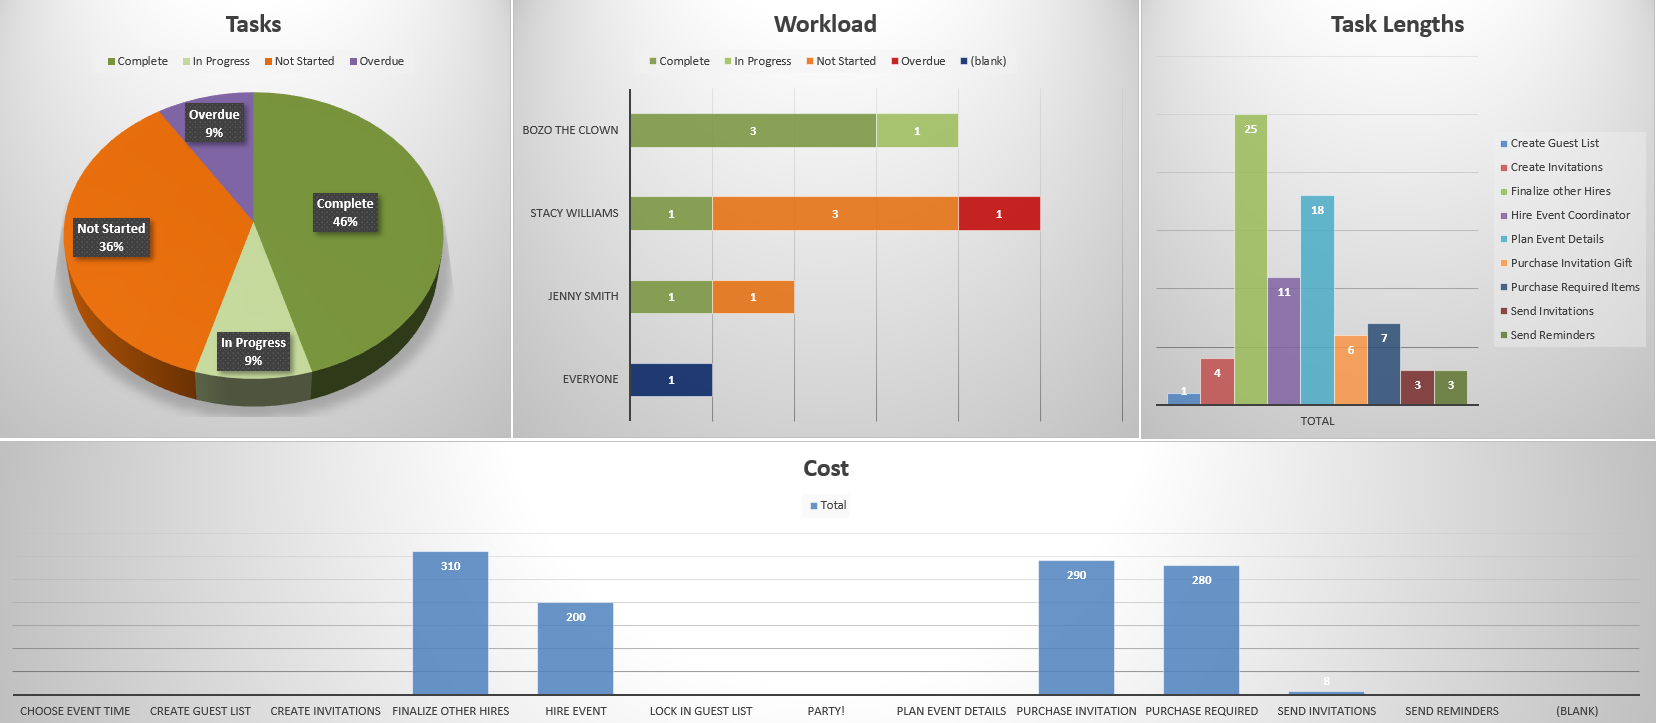
There’s a pie chart that captures the project tasks. It makes it easy to see at a glance what percentage of the team’s tasks have been completed, are in progress, aren’t yet started or are overdue, as well as the total. A workload bar chart shows the resource allocation for the project team. It’s color-coded to show work in progress, not started and overdue. A task length chart shows duration and a cost chart helps track the actual cost against the budget for that period.
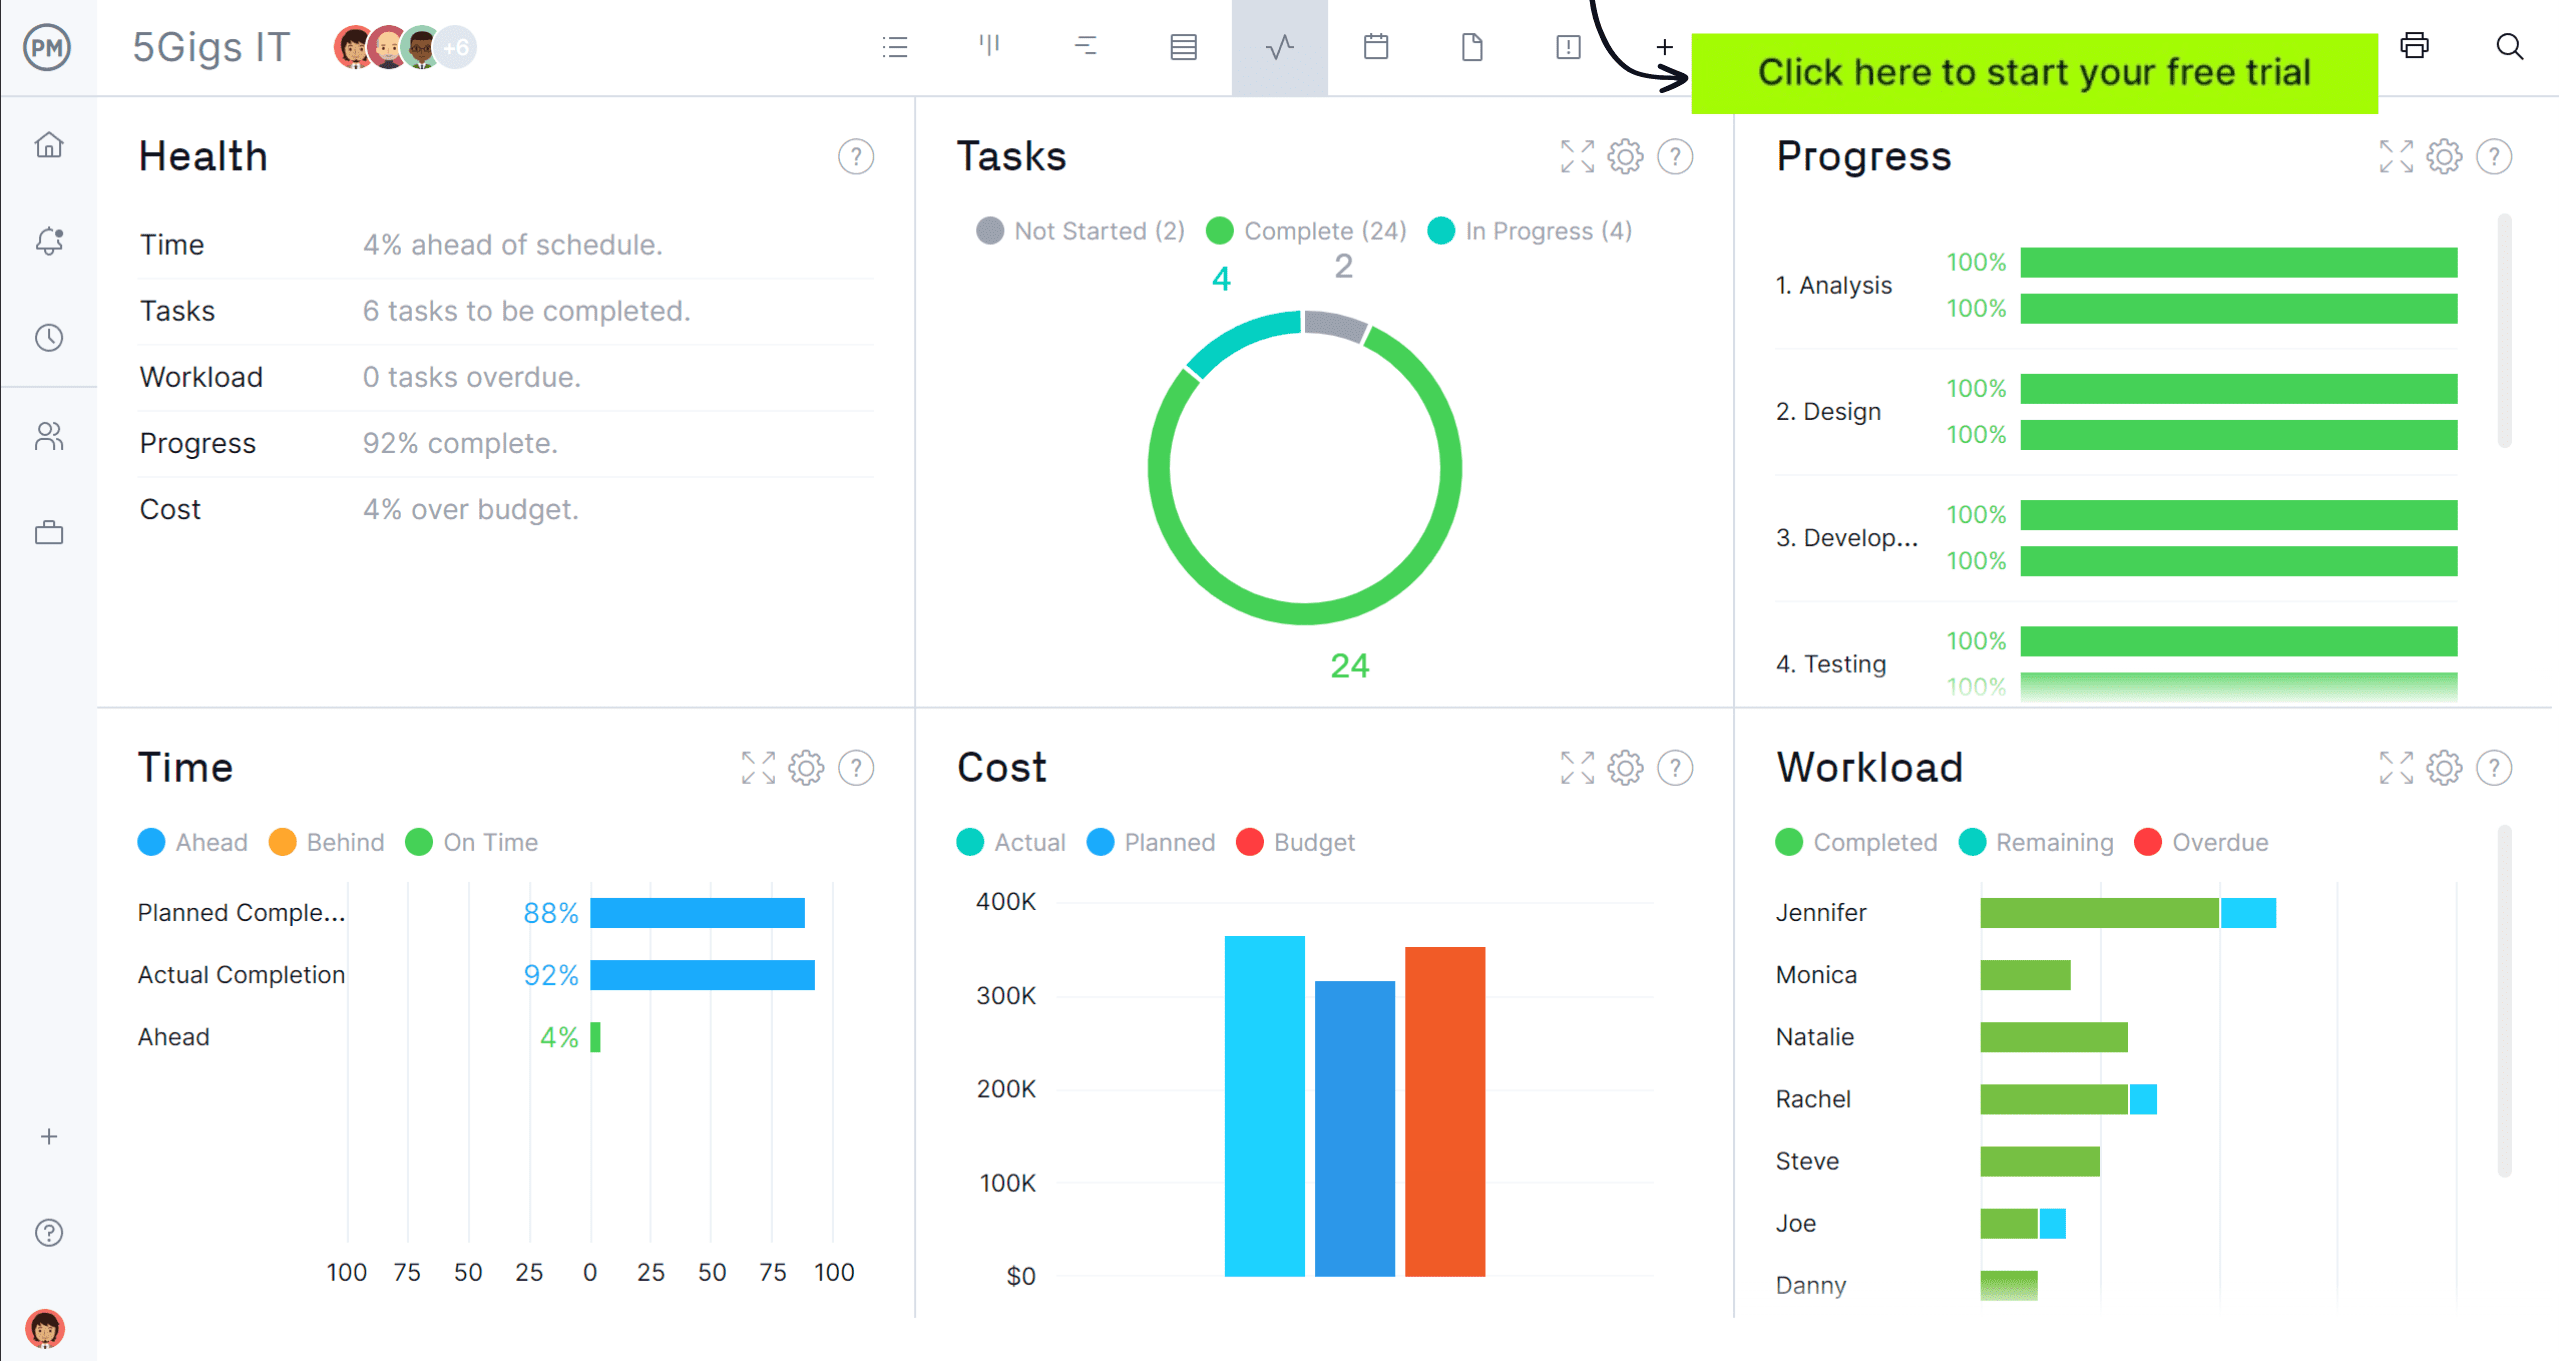
All of this information is crucial to managing a project, but so is working efficiently. Excel dashboard templates are just not going to provide the efficiency that is built into project management software. ProjectManager is award-winning project and portfolio management software with real-time dashboards for either a project and multiple projects. Because our dashboard is online, it collects live data automatically, there’s no need to manually update a template. Our live dashboards provide a current overview of the project’s performance and progress, which allows project managers to quickly make adjustments if necessary to get the work back on track. Templates can’t do that. Get started with ProjectManager today for free.
But, again, not everyone is ready to upgrade to project management software with real-time data visualization. For those looking for Excel dashboard templates to help as a task tracker, download this free KPI dashboard template for Excel. This is a great tool for providing critical information as it monitors, analyzes and displays KPIs to better manage organizations and projects.

This Excel dashboard has even more charts and graphs to help track the project timeline, budget and more. There’s even a yearly profit and loss overview with two charts, one showing revenue over time and the other expenses. This will help keep organizations aware of whether they’re in the red or the black. That data is even broken further down to monthly revenue, quarterly revenue, monthly expenses and quarterly expenses. There’s also a chart capturing workload analysis and one for resource planning, among others.
One of the most important KPIs to track is cost. This free budget dashboard template for Excel is a robust breakdown of project costs essential for keeping track of the budget and delivering projects without suffering cost overruns. There’s also space to add the job number, customer name, job description and start and completion dates. This is certainly one of the Excel dashboard templates needed to keep track of budgets.
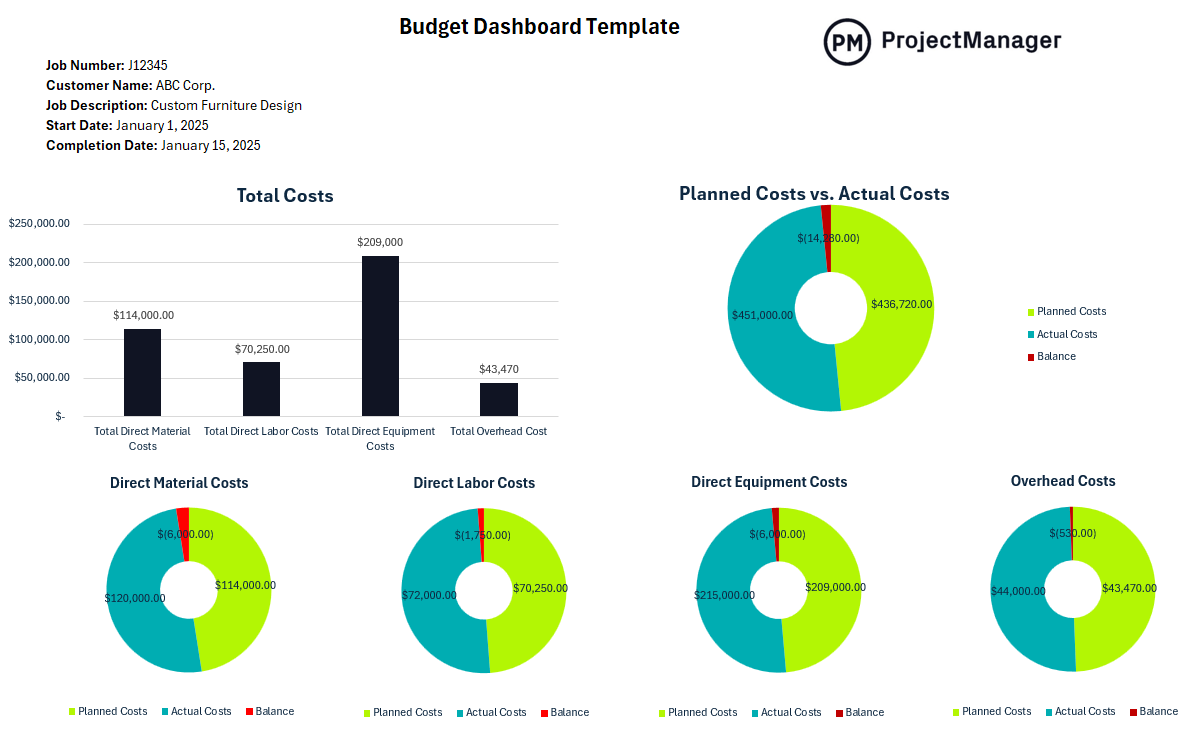
Beneath that are colorful pie charts that make this Excel spreadsheet easy to read and understand. For example, there’s one to show the planned costs against the actual costs, which helps project managers see if their current spending aligns with where the budget said they should be at this time. There are also pie charts for direct material costs, direct labor costs, direct equipment costs and overhead costs. A bar chart collects the total costs for an overview of the budget, which is another reason this Excel dashboard comes in handy when managing the budget.
4. Workload Dashboard Template for Excel
We’ve mentioned workload a few times already, but for those who aren’t familiar with the term, workload refers to the total amount of work assigned to a team member or group within a project. It’s usually measured in hours or tasks. Keeping track of workload ensures that team members are working at capacity, but not overallocated to the point of suffering from burnout, which erodes morale. Therefore, this is one of the Excel dashboard templates that everyone needs.
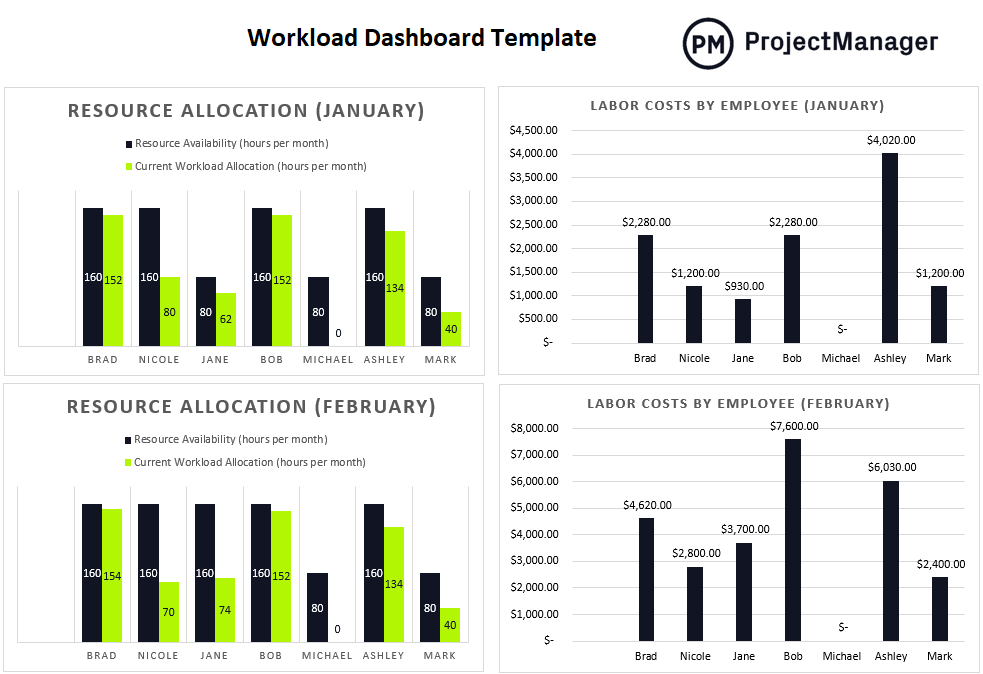
The free workload dashboard template for Excel is made up of four bar charts. On the left side are color-coded monthly resource allocation charts that show each team member’s resource availability (hours per month) in black and current workload allocation (again in hours per month) in yellow. This provides a monthly overview of the team’s resource allocation and can help project managers to balance their workload. Workload can also help with tracking labor costs. The right side of the Excel dashboard shows labor costs by employee in a chart for each month they’re working on the project.
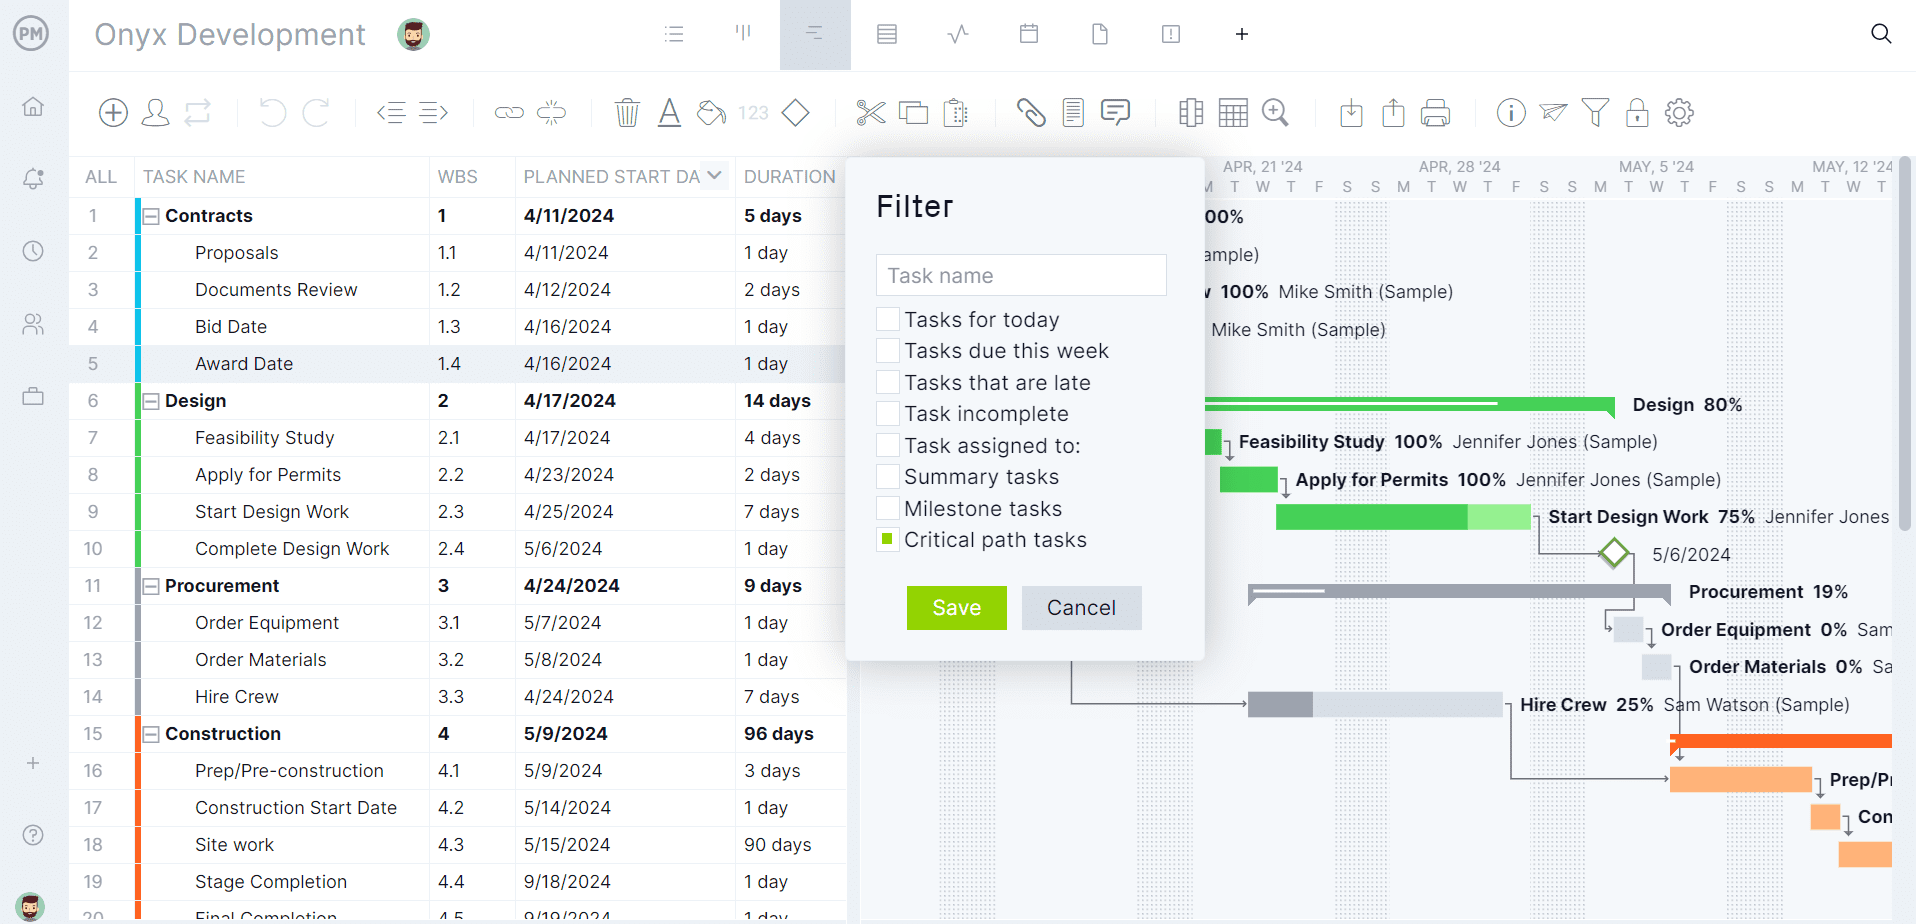
Project managers use a task tracker to organize, prioritize and monitor the progress of individual tasks within a project. This free task tracker dashboard template for Excel is a centralized location to manage all project details and improve collaboration between team members while helping project managers know what needs to be done, who is responsible and when each task is due.
![]()
![]()
As Excel dashboard templates go, this one is another must-have. It is made up of a couple of charts and pie charts that are color-coded to make it easy to digest them easily and fast. There’s one for task priority levels, which has the status on the left column, which goes from very low to critical. There are also columns for count and percentage. There’s another, set up the same, only this tracks task status, from on hold to not started. This information is then translated to pie charts that visually show the percentage and color codes for those who prefer to get their information that way.
Benefits of Using Excel Dashboard Templates
We’ve been talking about the importance of Excel dashboard templates and why they’re beneficial to project managers and their teams. To reiterate and provide more detail, we’ve listed the benefits of using an Excel dashboard in project management below.
- Dashboards bring together various project data in a centralized location, which makes it easier to track and monitor progress across different aspects.
- Excel dashboards can be updated regularly to reflect close-to-real-time data, giving project managers an updated view of how the project is progressing.
- With data presented in an easily digestible format, project managers can quickly identify problems or areas that need attention and make informed decisions faster.
- Graphs and charts help simplify complex data, making it easier for stakeholders to understand and access the project status without needing to dive into raw data.
Disadvantages of Using Excel Dashboard Templates
While Excel dashboard templates can be useful, they’re not a perfect project management tool. We’ve already noted some ways they are inferior to project management software. Here are some general disadvantages.
- Many pre-designed templates have fixed structures, which might not suit every project’s unique needs. Customizing templates is time-consuming and challenging.
- As the project grows or becomes more complex, the template might not scale effectively, creating issues with handling large amounts of data, slow performance or clutterness.
- Excel dashboards rely heavily on manual data entry or data imports. If the data isn’t consistently updated or entered correctly, it can lead to inaccurate results, which could impact decision-making.
- Unless specifically designed with automation or integration features, Excel templates don’t typically pull real-time data from other sources, which could result in outdated information unless manually refreshed.
ProjectManager Is a Better Project Tracking Tool Than Excel Dashboard Templates
While Excel dashboard templates have a place in project management, it’s mostly a stepping stone to more sophisticated tools. Sure, try out these free dashboard templates and get a handle on how useful they are in monitoring project metrics to meet deadlines and stay on budget. But chances are frustration will settle in soon enough. After all, these are only static documents that must be manually updated and are poor collaboration tools. ProjectManager is award-winning project and portfolio management software with real-time project and portfolio management dashboards. But that’s only one feature of many to deliver successful projects.
Multiple Project Planning and Scheduling Views
Before one can track data, projects must be planned and tasks, resources and costs scheduled. Our software has multiple project views to do that and execute the work. Project managers prefer the robust Gantt charts that schedule tasks, resources and costs, but also link all four types of task dependencies to avoid delays and cost overruns. They can filter for the critical path rather than go through timely and complicated calculations. Then, once a baseline is set, progress and performance are tracked in real time. Plans are shared across the visual workflow of kanban boards and powerful task lists for teams to execute their work, while stakeholders can stay updated with the calendar view.
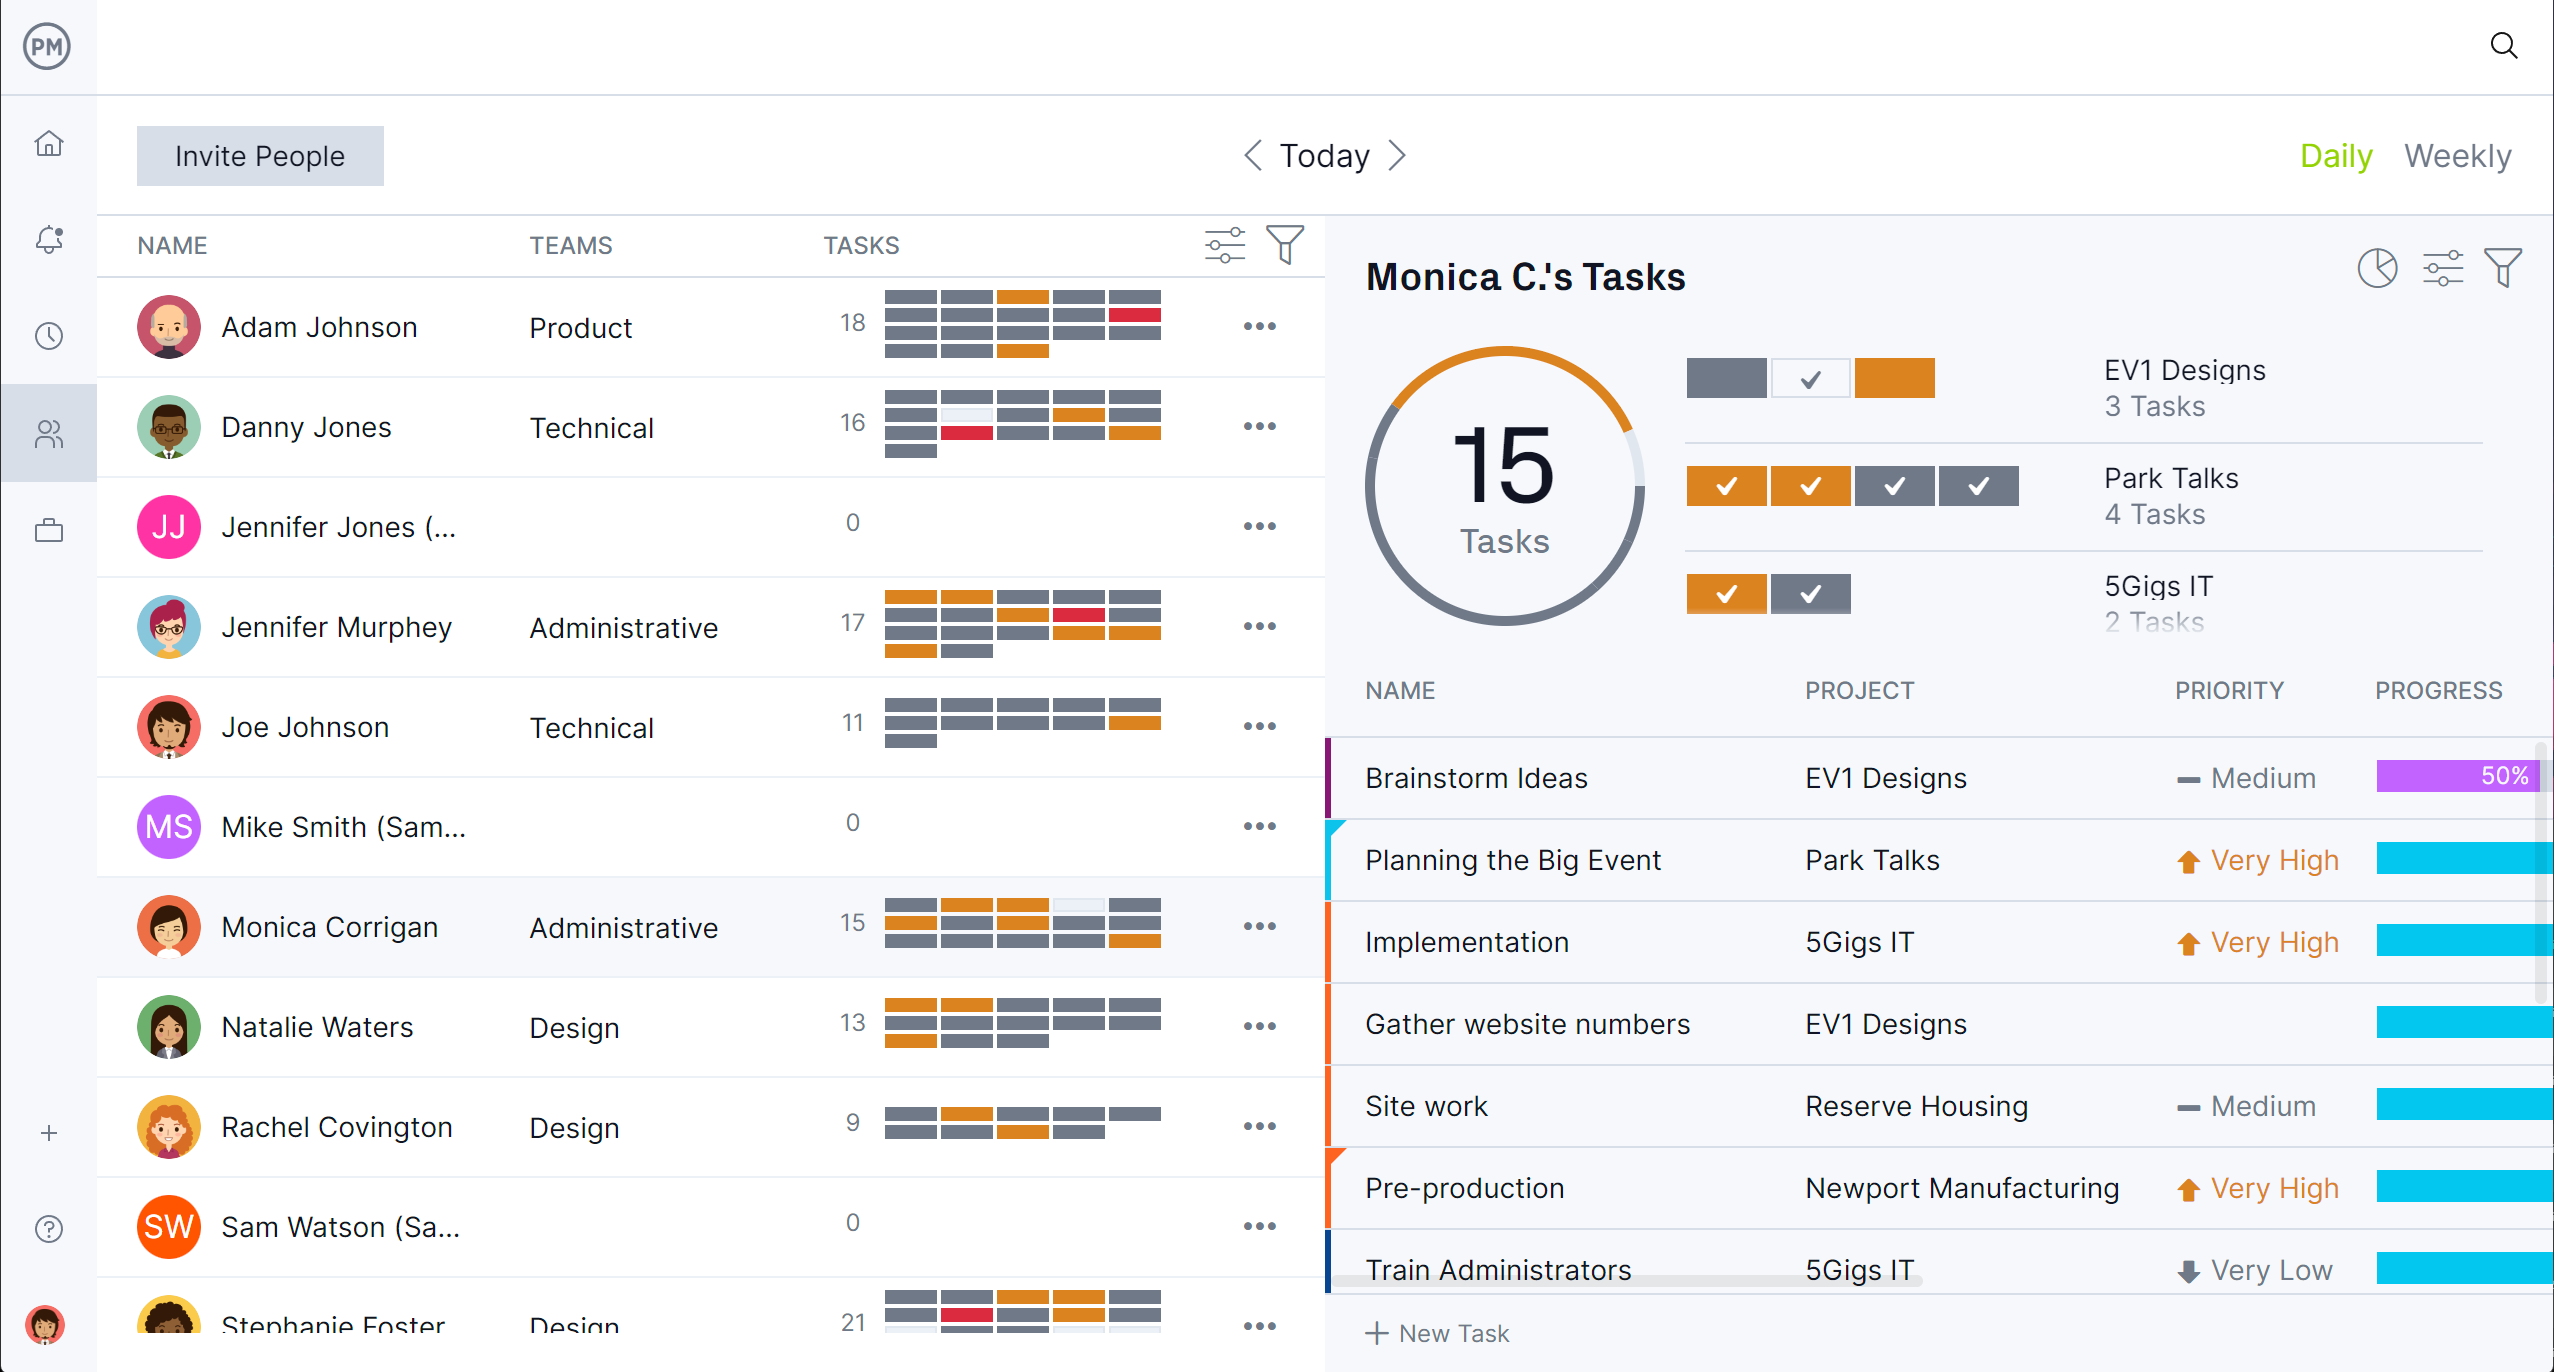
Robust Resource Management Features
Many of the dashboards include workload, as does ours, but real project management software will have resource management tools, as well. As noted above, both human and nonhuman resources can be scheduled on the Gantt. When onboarding teams, project managers can set their availability according to PTO, vacation and global holidays, as well as skill sets, which makes assigning tasks easier. There’s a color-coded workload page to view resource allocation and balance team workload to keep everyone working at capacity. Our team page summarizes team activities, which can be filtered by priority, progress and more. Even our secure timesheets, which streamline payroll, also measure how far each team member has gotten in completing tasks.
Of course, there’s more. Automated workflows with task approvals for quality control, version control, global search and unlimited file storage, email and in-app notifications and risk management tools. But first, try the free Excel dashboard templates, then take a free trial and join the successful teams at Avis, Nestle and Siemens who use our software to deliver successful projects. Get started with ProjectManager today for free.

