


Using a Google Sheets dashboard is a smart, accessible way to gain real-time visibility into your business or project data. Whether you’re tracking KPIs, managing team performance or monitoring budgets, a dashboard brings key metrics together in one place. It turns raw data into clear visual insights using charts, graphs and summaries—helping you make faster, data-driven decisions without needing advanced software.
A well-designed Google Sheets dashboard template takes this a step further by providing a ready-made structure that saves you time. Instead of building from scratch, you can plug in your data and immediately get a visual overview of your operations. These templates are customizable, easy to share and ideal for teams who need transparency across departments or stakeholders.
For project management, a Google Sheets dashboard template simplifies tracking tasks, deadlines and progress. For business reporting, it gives you snapshots of financials, sales, inventory or performance in one view. This roundup of dashboards highlights some of the most useful templates that can help streamline your workflows and keep your team aligned.
1. Project Tracking Google Sheets Dashboard
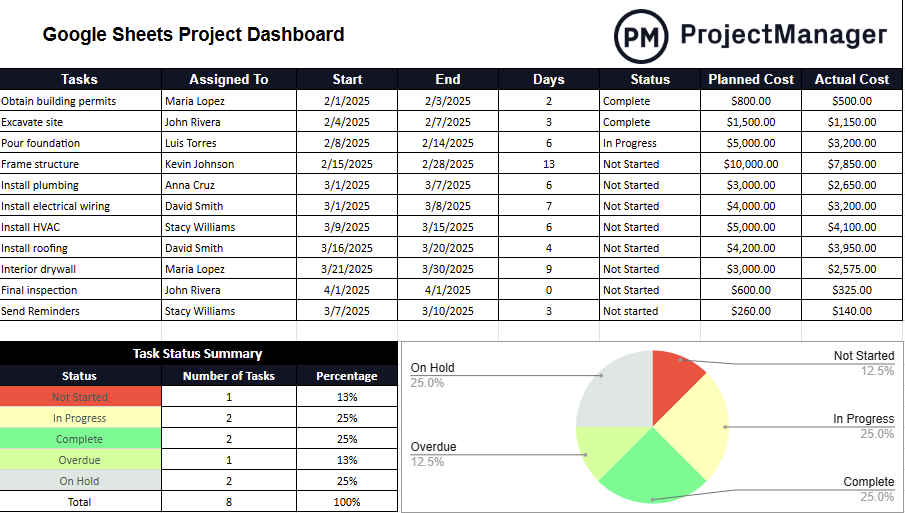
A project tracking Google Sheets dashboard is a practical way to monitor project milestones, task progress and deadlines in one centralized place. It gives project managers and team members a visual overview of work status using tools like Gantt-style bars, conditional formatting for task statuses and progress indicators.
This makes it easier to keep track of what’s been completed, what’s in progress and what might be falling behind schedule. Whether you’re running a marketing campaign, software sprint or construction job, this dashboard helps keep deliverables aligned and projects moving forward.
This template is especially useful for small teams or businesses looking for a lightweight solution without investing in complex software. With a project tracking dashboard in Google Sheets, updates can be made in real-time, shared across departments and viewed from any device.
Users can also customize fields to match their project’s unique workflow. While it may lack some advanced automation, it provides an accessible way to bring visibility to project health, maintain accountability and identify roadblocks early—all within a tool many teams are already familiar with.
2. KPI Google Sheets Dashboard
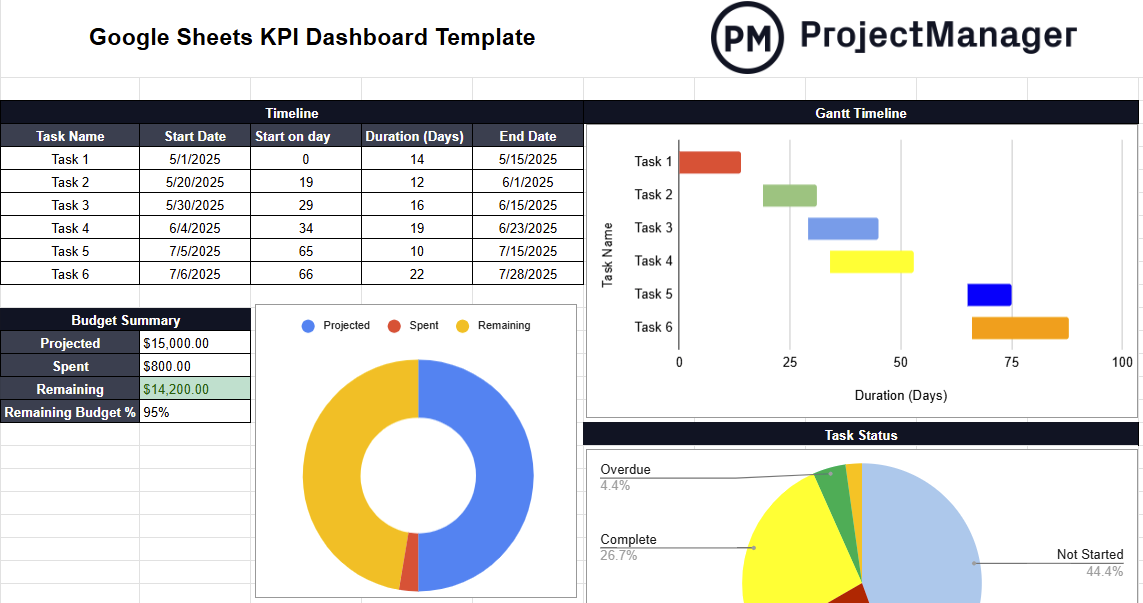
A KPI Google Sheets dashboard is a powerful tool for measuring performance across departments, teams or entire organizations. It helps managers and executives visualize key performance indicators—such as revenue growth, conversion rates or productivity metrics—in real time.
By using graphs, tables and conditional formatting, a well-built KPI dashboard transforms complex data into insights that are easy to interpret and share. It supports quick decision-making and keeps business goals front and center for everyone involved.
A Google Sheets dashboard template specifically designed for KPIs saves time and ensures consistency in reporting. Rather than building from scratch, users can plug in their data and instantly generate performance visuals. These templates are easy to modify, making them suitable for monthly reporting, team reviews or executive presentations. They’re also cloud-based and collaborative, so multiple stakeholders can access and update them as needed, no matter where they’re located.
However, these templates often require manual updates and don’t offer live data feeds. That’s where ProjectManager’s real-time dashboard comes in. Unlike static templates, our project and portfolio dashboards automatically pull live data from ongoing tasks and projects, displaying up-to-date KPIs with no extra effort. This gives managers an accurate, dynamic snapshot of performance, costs, time and more, allowing them to respond to changes immediately—without sifting through spreadsheets. Get started with ProjectManager today for free.
3. Budget Tracker Google Sheets Dashboard
A budget tracker Google Sheets dashboard helps manage project finances by clearly displaying planned costs, actual spending and budget variances. With this type of dashboard, users can track expenses across categories, spot overspending early and adjust allocations as needed. Charts and graphs make it easy to visualize trends and compare projections to reality, ensuring financial visibility throughout the project lifecycle.
![]()
![]()
Using a budget dashboard template in Google Sheets simplifies setup and ensures consistency across projects. These templates can include automated calculations, dropdown menus for cost categories, and color-coded alerts for budget overruns. Because Google Sheets is cloud-based, stakeholders can collaborate on the same file in real time, improving transparency and reducing the risk of duplicate entries or outdated figures. It’s a reliable option for project managers, finance teams and small business owners who want financial oversight without needing complex accounting software.
4. Workload Google Sheets Dashboard
A workload Google Sheets dashboard allows teams to visualize how tasks are distributed across members and identify imbalances before they impact productivity. It provides a clear overview of who’s working on what, when and how much capacity they have left. Using charts or heat maps, managers can identify overloaded team members and reassign tasks to enhance efficiency and prevent burnout.
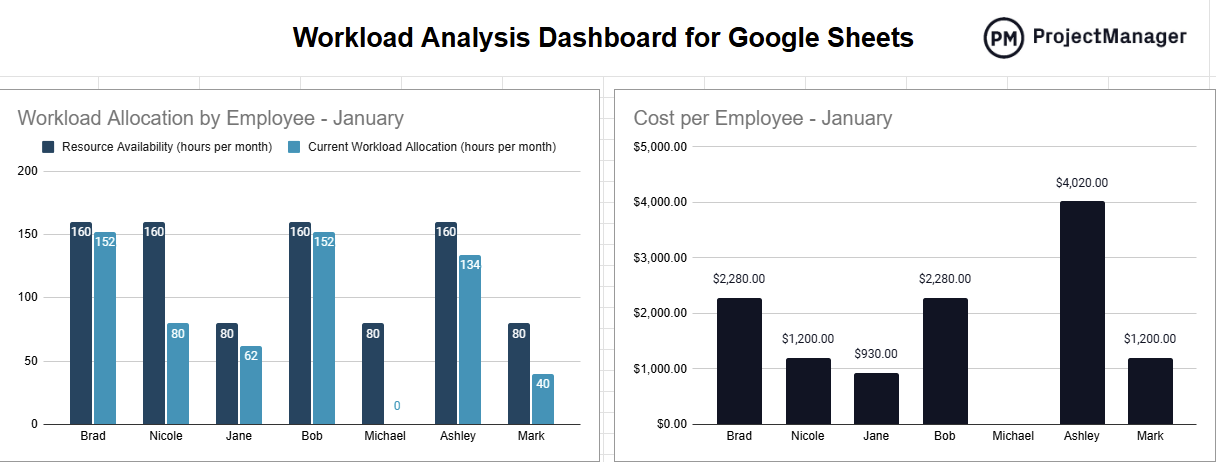
These dashboards are particularly useful for teams managing multiple projects or juggling competing deadlines. With the help of a Google Sheets dashboard template, workload data can be organized by team member, task or time frame. Color-coded cells, automated formulas and conditional formatting make it easy to track capacity and ensure equitable distribution of work. Since it’s built in Google Sheets, teams can access it from anywhere and update it live, making it a useful collaboration tool as well.
5. Task Tracker Google Sheets Dashboard
A task tracker Google Sheets dashboard is a simple but effective tool for staying on top of daily responsibilities, milestones and deadlines. It offers a clear layout of all tasks, their assigned owners, statuses and due dates. This visual clarity helps individuals and teams manage workloads more effectively and ensures nothing falls through the cracks. It’s especially helpful in fast-paced environments where visibility and accountability are crucial.
![]()
![]()
Using a Google Sheets dashboard template for task tracking removes the hassle of setting everything up from scratch. Most templates come with built-in progress bars, status dropdowns and conditional formatting to automatically update task statuses. Whether used for individual productivity or team coordination, this kind of dashboard streamlines task management and promotes transparency. It’s a low-cost, high-impact way to organize workflows and keep everyone aligned.
Related: 10 Free Task Management Templates
Benefits of Using a Google Sheets Dashboard Template
A Google Sheets dashboard template offers an efficient and accessible way to visualize data, track performance and manage workflows without needing specialized software. With prebuilt layouts and formulas, these templates eliminate the need to build dashboards from scratch—saving time and reducing the risk of formatting errors. Whether you’re monitoring KPIs, tracking a budget or managing project tasks, a template provides an organized framework to help you stay focused and informed.
One of the biggest advantages is ease of use. Most teams are already familiar with Google Sheets, so there’s no learning curve involved. Templates are cloud-based, allowing for real-time collaboration and updates from anywhere. Multiple users can view and edit dashboards simultaneously, making them ideal for remote or hybrid teams. Additionally, templates are highly customizable—you can adapt them to suit your goals, whether you’re working in finance, operations, marketing or project management.
Templates also enhance decision-making by transforming raw data into charts, graphs and summaries. They offer quick insight into trends and outliers, helping you make informed choices faster. With built-in calculations, filters and conditional formatting, Google Sheets dashboard templates provide a powerful, no-cost solution for small businesses and teams that need clear, consistent reporting.
Disadvantages of Using a Google Sheets Dashboard Template
While Google Sheets dashboard templates are convenient and user-friendly, they also come with limitations—especially as projects grow in size and complexity. One major drawback is the need for manual updates. Unless you connect your dashboard to external data sources using scripts or third-party add-ons, you’ll need to input or refresh data manually. This creates a risk of outdated information and data entry errors, which can lead to misinformed decisions.
Another limitation is performance. As the volume of data increases, especially across multiple sheets and tabs, Google Sheets can slow down or become harder to manage. Complex dashboards with numerous formulas and visual elements may also become difficult to troubleshoot or share across teams. And while customization is possible, building more advanced dashboards often requires spreadsheet expertise, which not all team members may have.
Lastly, templates don’t offer the automation, security or real-time data syncing of dedicated project management software. They can’t pull in live task updates, integrate deeply with other tools, or provide audit trails and user-level permissions. For teams managing multiple projects or seeking real-time oversight, a static dashboard may fall short. In these cases, a platform like ProjectManager offers a stronger alternative with dynamic dashboards, automated tracking and built-in collaboration features designed for high-performance environments.
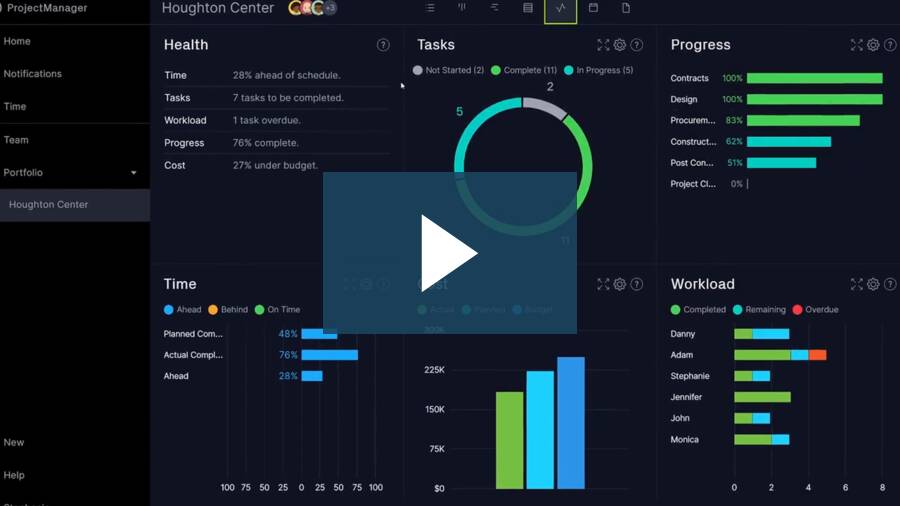
ProjectManager Is Better Than a Google Sheets Dashboard
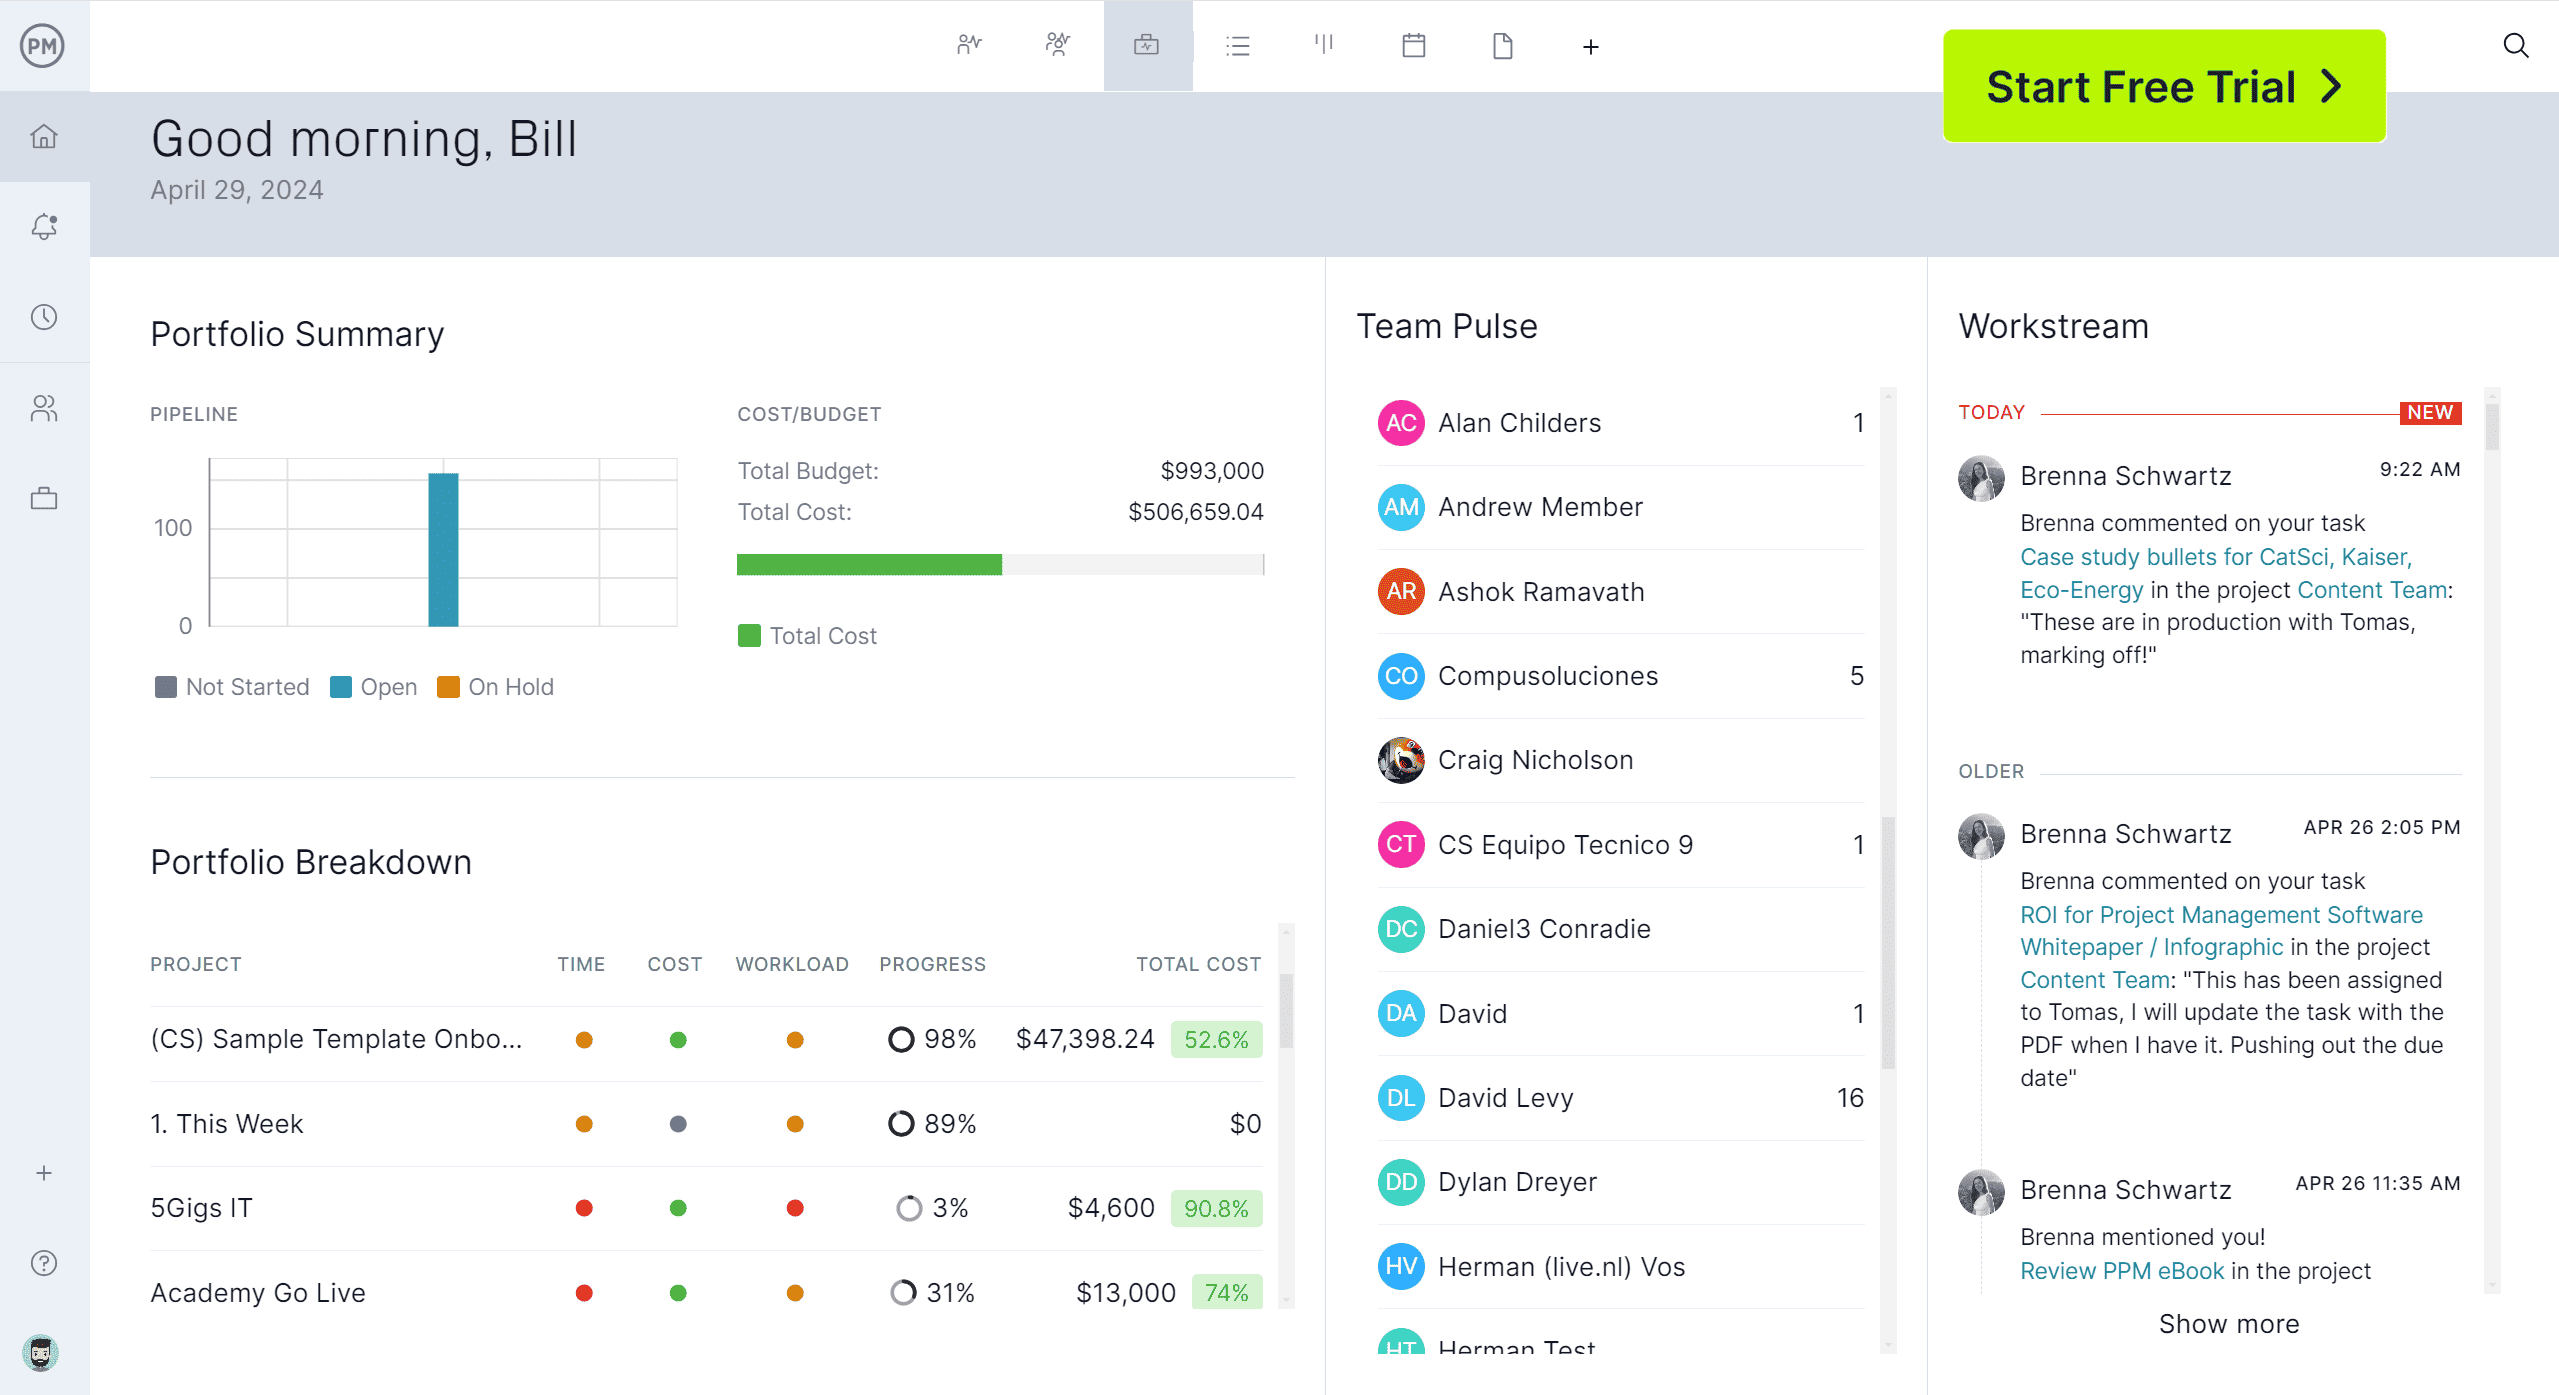
ProjectManager offers a more powerful and scalable alternative to a Google Sheets dashboard by combining real-time dashboards with dynamic reporting tools and secure timesheet tracking. While Google Sheets can provide visual snapshots of data, our software goes further by automatically updating project status, budgets and team performance as work happens.
Customizable reports can be generated instantly for stakeholders, giving leadership precise insights without the manual upkeep that spreadsheets require. Our integrated and secure timesheets also ensure accurate tracking of hours, making payroll and forecasting much easier to manage within the same system.
Learn more about our dynamic project dashboards in the short video below.
Manage Projects With Multiple Project Views
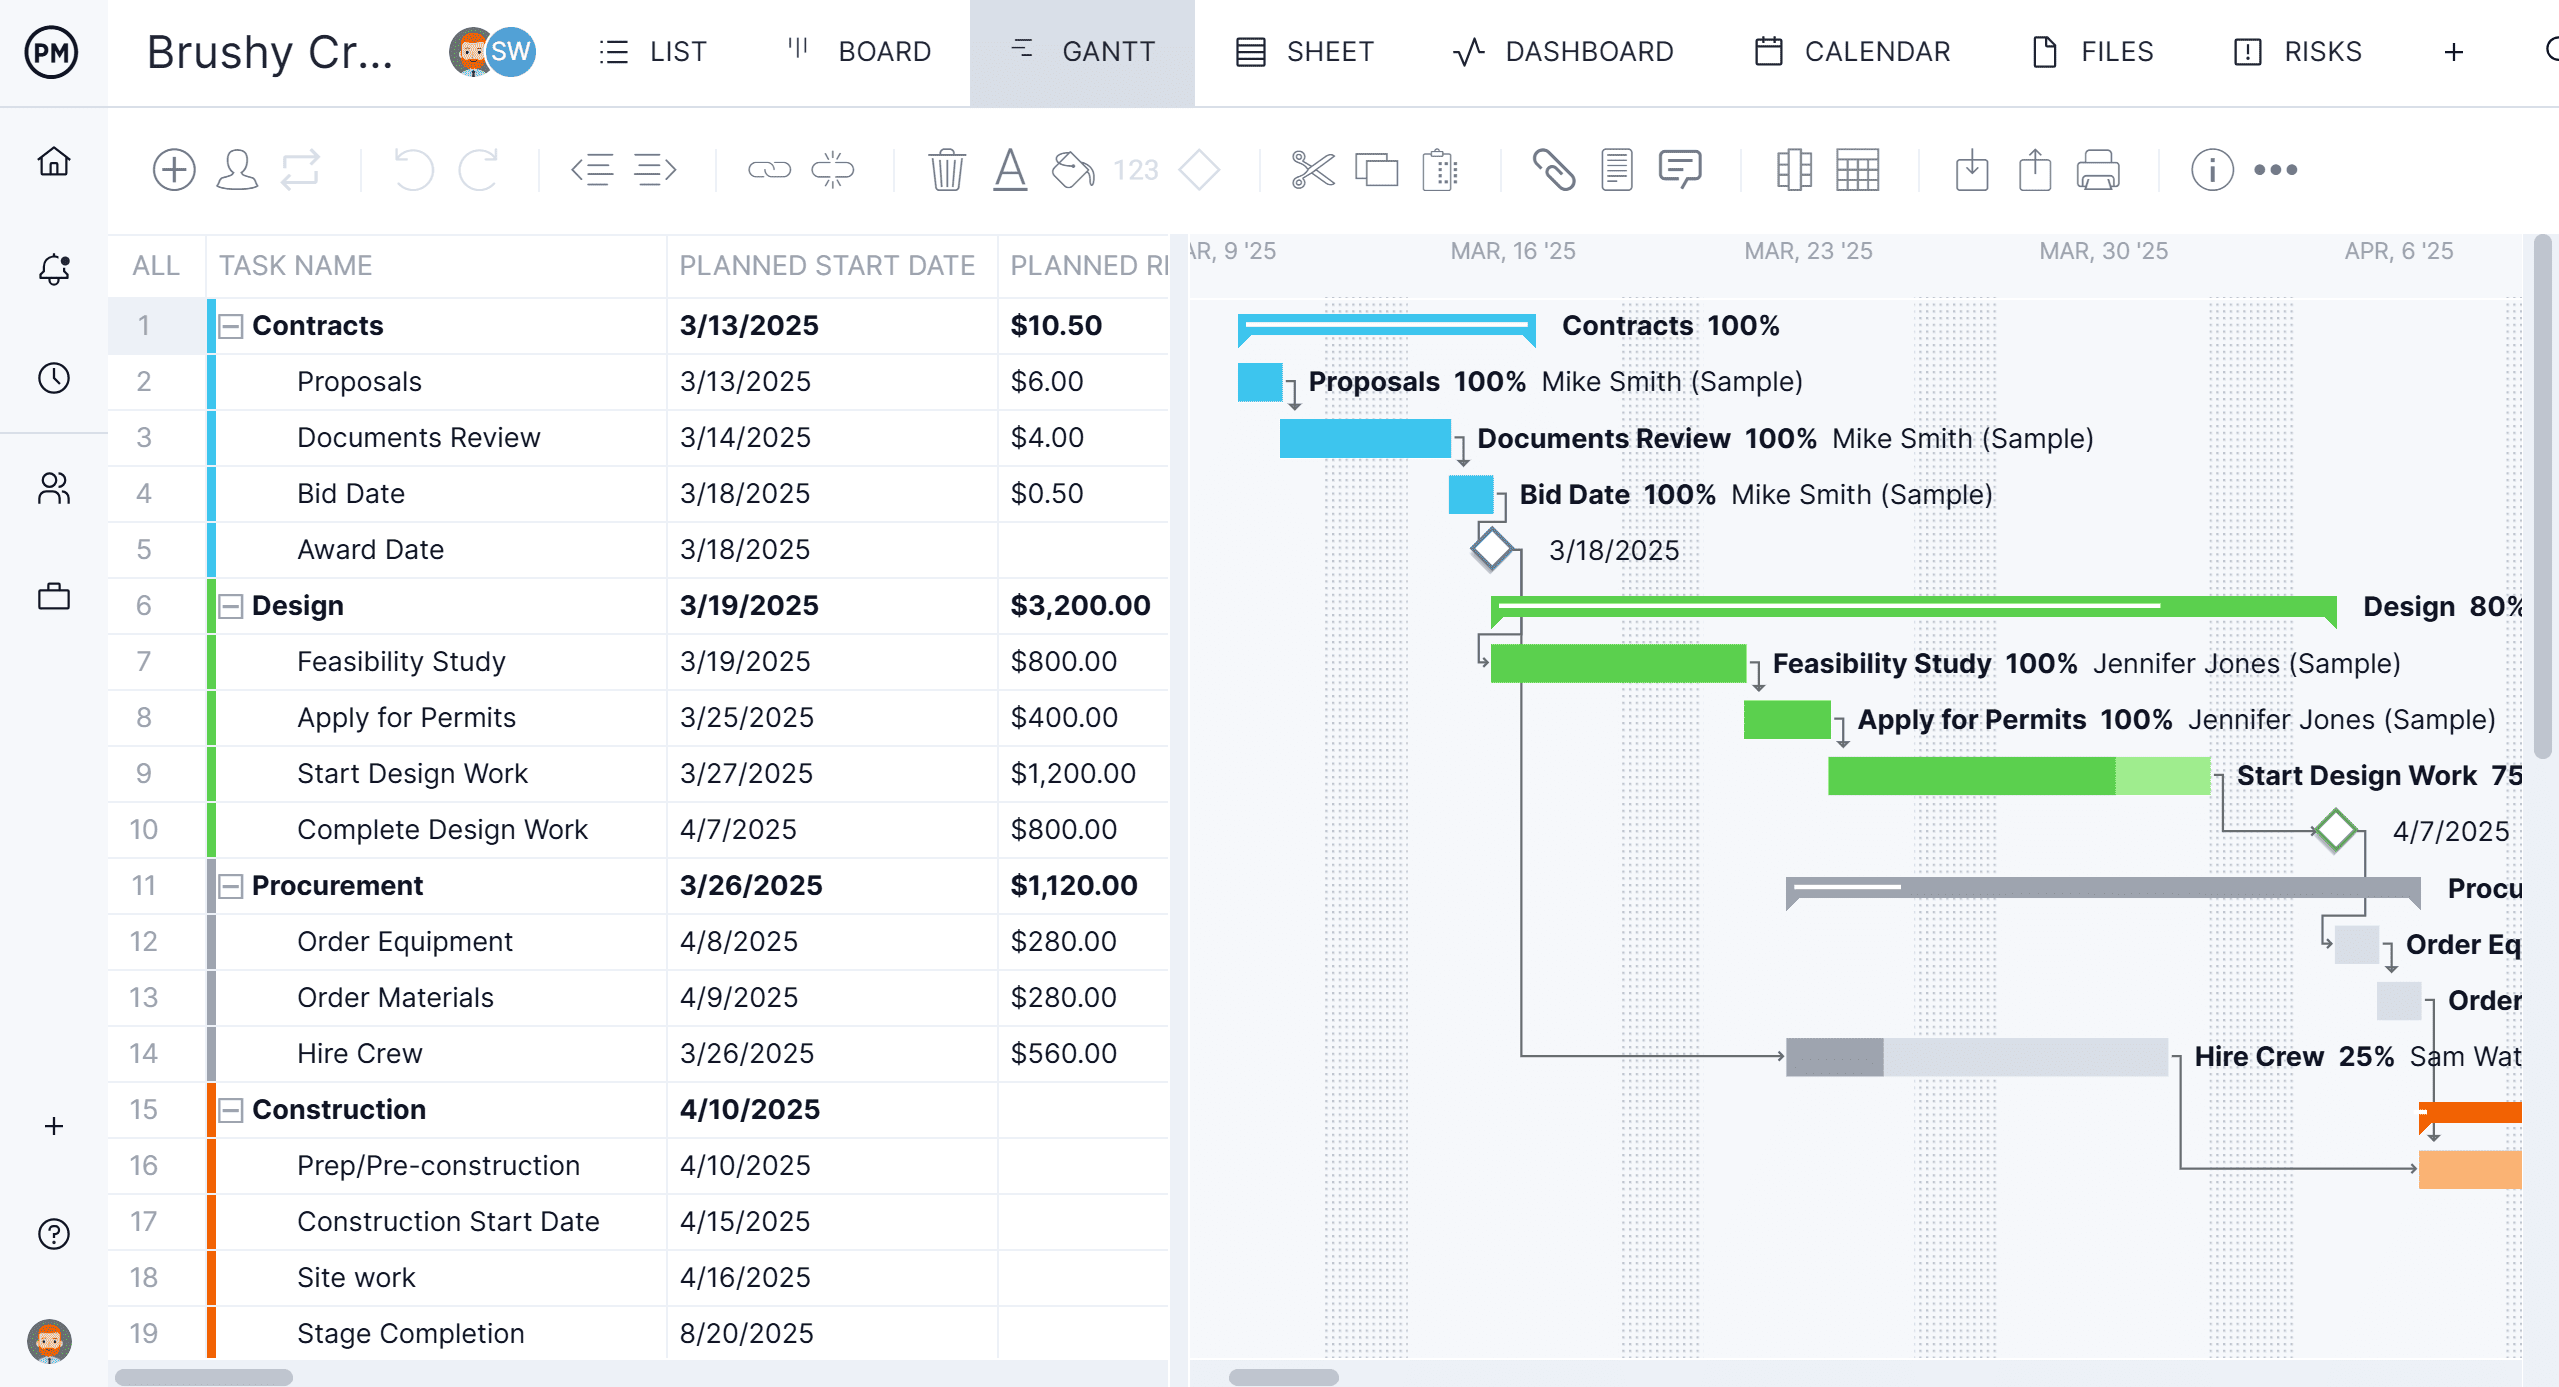
While a Google Sheets dashboard is usually tied to a single project or data set, our platform supports different project views—like Gantt charts, kanban boards, calendars and task lists—that update in real time. These views can be filtered and switched depending on the user’s role or preference, making it easier to monitor progress across projects without switching tools.
For example, task lists are crucial for breaking down work into actionable steps and giving team members clear visibility into their responsibilities and deadlines. Gantt charts excel at scheduling work on a timeline, linking dependencies to avoid cost overruns, filtering for the critical path to identify tasks with zero slack and setting a baseline to track project variance in real time.
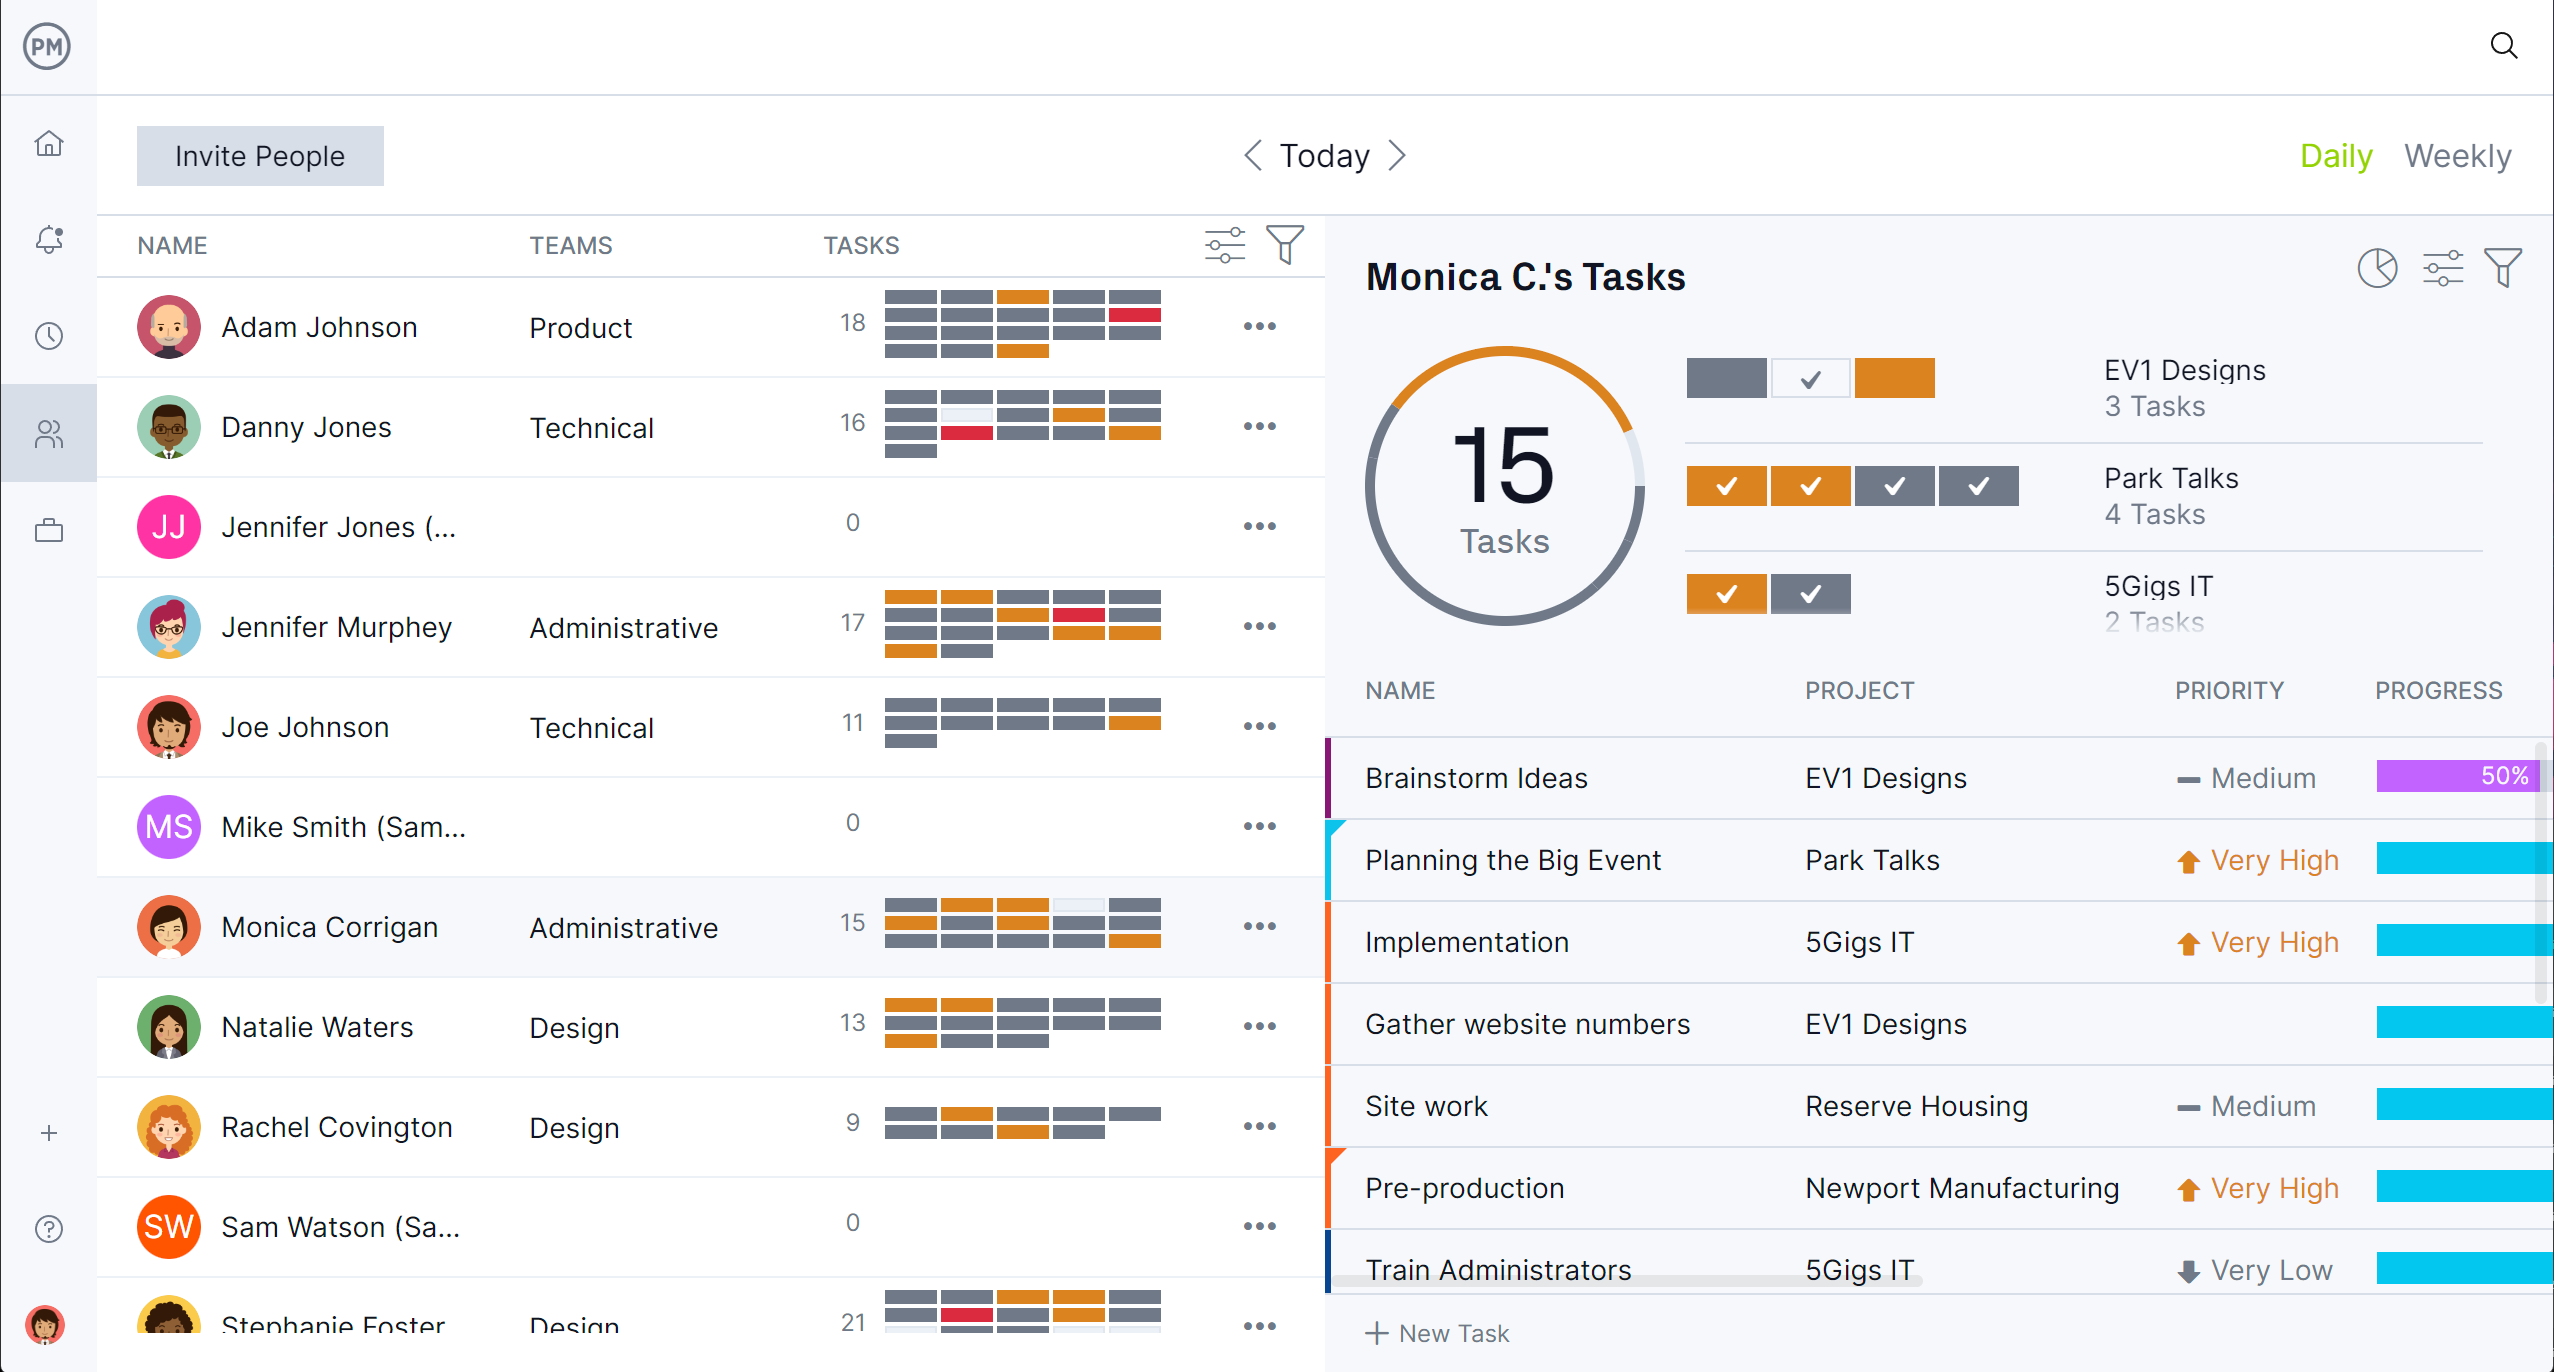
Balance Workload, Track Availability and More With Resource Tools
We also outperform spreadsheets in resource management. It tracks team availability, planned hours and actual workload in one place, giving managers a clear picture of how their resources are being utilized. The color-coded workload chart makes it easy to spot overbooked or underutilized team members, helping prevent burnout or inefficiencies.
Most importantly, the dedicated team page centralizes all personnel details—including roles, capacity and current assignments—making scheduling and planning far more strategic and data-driven than what’s possible in Google Sheets.
Related Google Sheets Dashboard Content
Looking for more than a Google Sheets dashboard template? How about 32 free Google Sheets templates? Or free Excel dashboard templates? There’s that and many more to find in the links below.
ProjectManager is online project and portfolio management software that connects teams whether they’re in the office or out in the field. They can share files, comment at the task level and stay up to date with email and in-app notifications. Join teams at Avis, Nestle and Siemens who are using our software to deliver successful projects. Get started with ProjectManager today for free.


