Bitcoin investing can be as straightforward or as complex as you choose. Yet, by utilizing a few free and powerful metrics, investors can gain a considerable edge over the average market participant. These tools, available for free, simplify on-chain analysis and help strip away emotional decision-making.
Realized Cap HODL Waves
The Realized Cap HODL Waves metric is one of the more nuanced tools in the on-chain toolbox. It analyzes the realized price, the average cost basis for all Bitcoin held on the network, and breaks it down by age bands. A significant set of age bands is coins held for three months or less. When this segment dominates the realized cap, it indicates a flood of new capital entering the market, typically driven by retail FOMO. Historical peaks in these younger holdings, often shown in warm colors on the chart, have coincided with major market tops, like those in late 2017 and 2021.
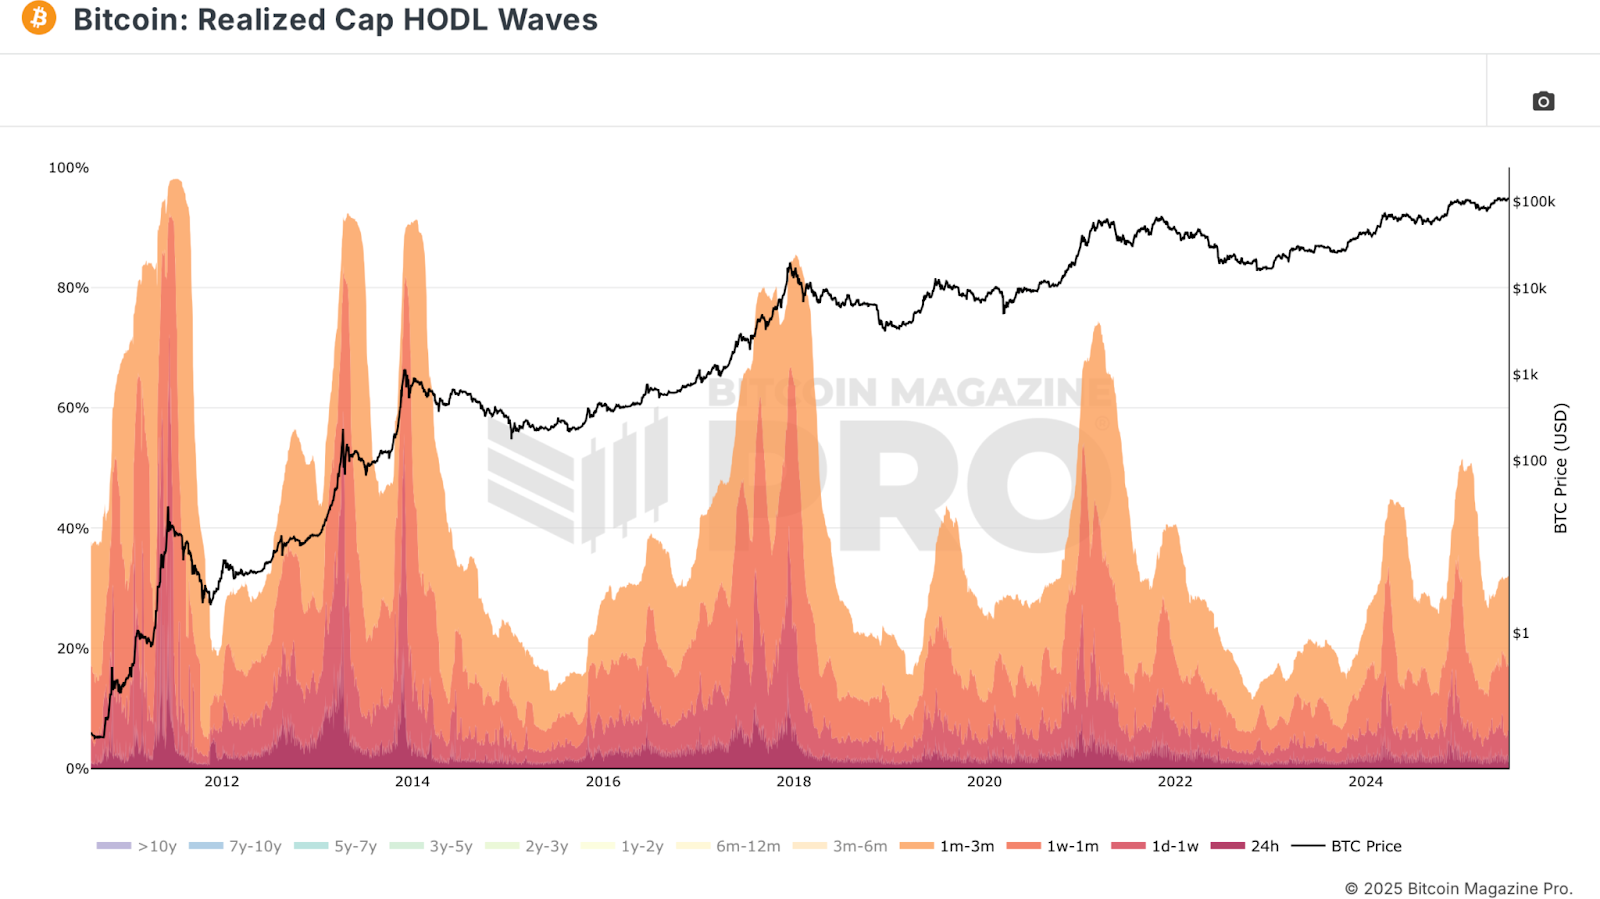
Conversely, when the influence of short-term holders diminishes to a low, it generally aligns with bear market bottoms. These are periods when few new buyers are entering, sentiment is bleak, and prices are deeply discounted. This metric can visually reinforce contrarian strategies, buying when others are fearful and selling when greed dominates.
Puell Multiple
The Puell Multiple helps gauge the sentiment of miners by comparing their current daily revenue (in USD) in block rewards and fees against a one-year average. High values indicate miners are extremely profitable, while low values suggest distress, potentially signaling undervaluation.
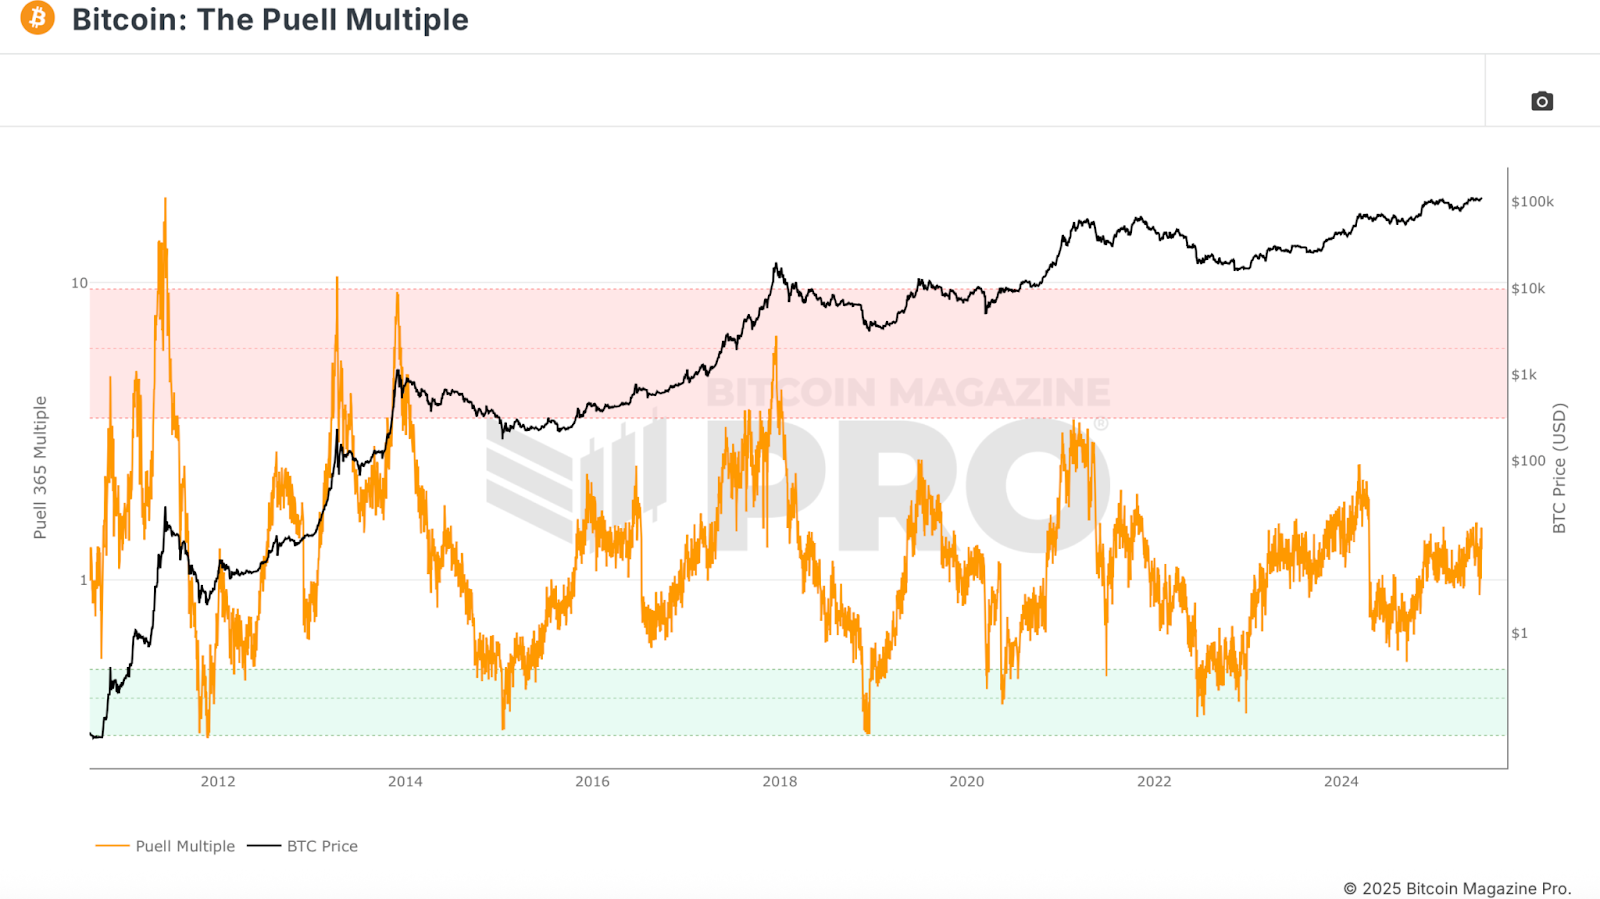
During previous cycles, lows in the Puell Multiple have been excellent opportunities for accumulation, as they coincide with times when even miners, with high costs and operational risks, are struggling to remain profitable. This acts as an economic floor and a high-confidence entry signal.
MVRV Z-Score
The MVRV Z-Score is perhaps the most widely recognized metric in the on-chain arsenal. It standardizes the ratio between market value (current price multiplied by the circulating supply) and realized value (average cost basis or realized price), normalizing it across Bitcoin’s volatile history. This z-score identifies extreme market conditions, offering clear signals for tops and bottoms.
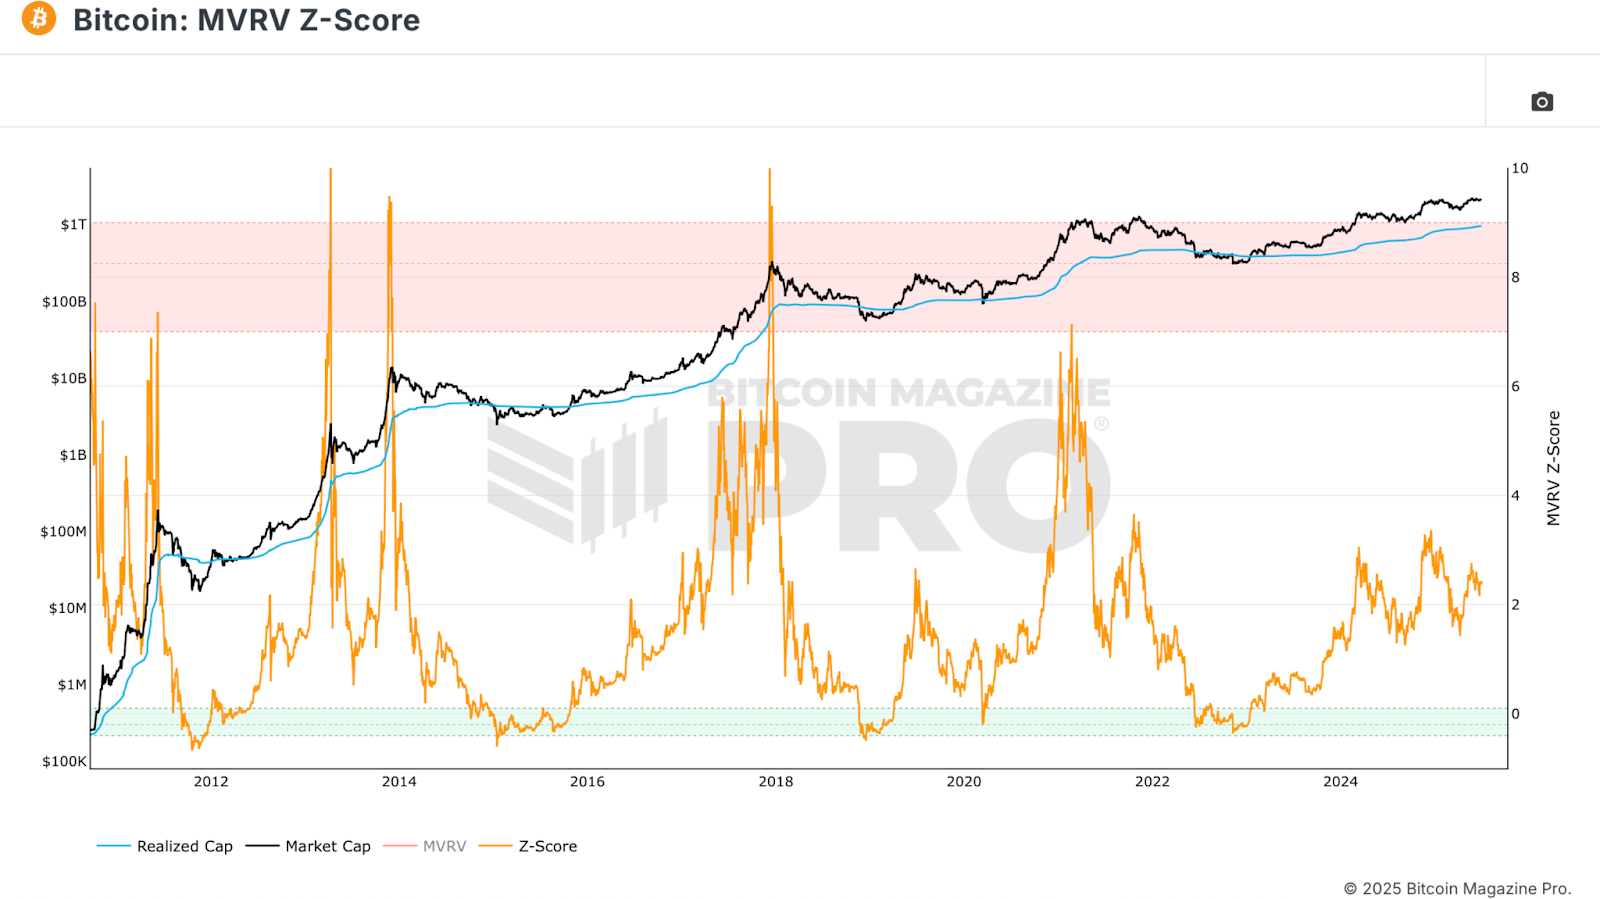
Historically, a z-score above 7 indicates euphoric market conditions ripe for a local top. A z-score below zero often aligns with the most attractive accumulation periods. Like any metric, it shouldn’t be used in isolation. This metric is extremely effective when paired with some of the others discussed in this analysis for confluence.
Funding Rates
Bitcoin Funding Rates reveal the sentiment of leveraged futures traders. Positive funding means longs are paying shorts, suggesting a bullish bias. Extremely high funding often coincides with euphoria and precedes corrections. Negative funding, conversely, shows fear and can precede sharp rallies.
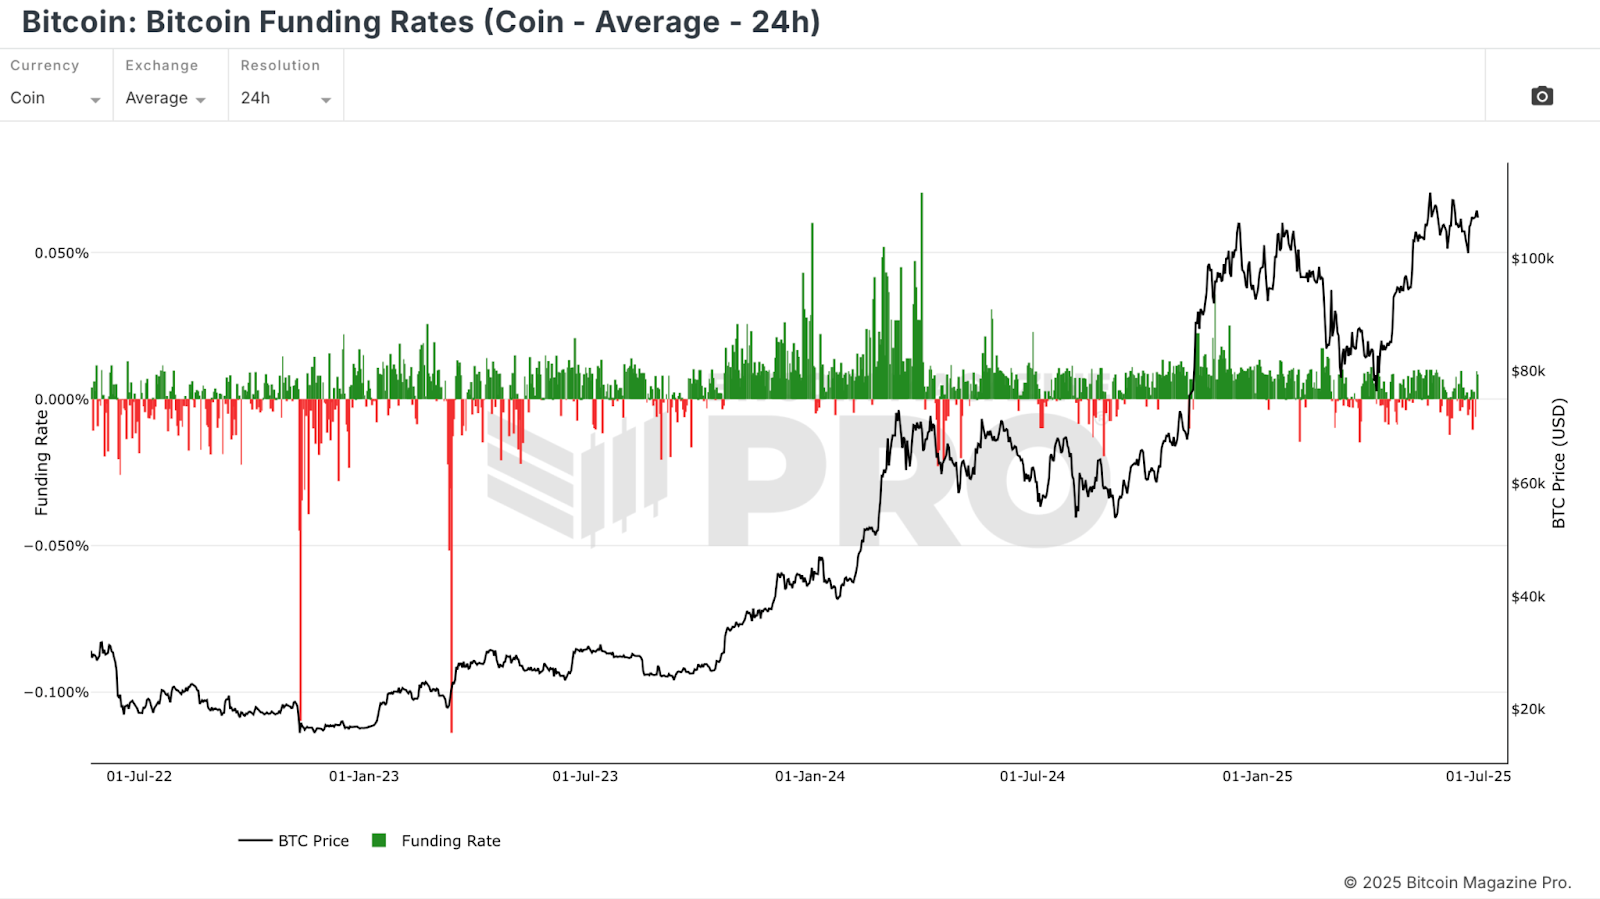
Coin-denominated funding rates offer a purer signal than USD pairs, as traders are risking their BTC directly. Spikes in either direction often signal contrarian opportunities, with high rates warning of overheating and low or negative rates hinting at bottoms.
SOPR
The Spent Output Profit Ratio (SOPR) tracks whether coins moved on-chain were in profit or loss at the time of transaction. A reading above zero means the average coin moved was sold in profit; below zero suggests realized losses.
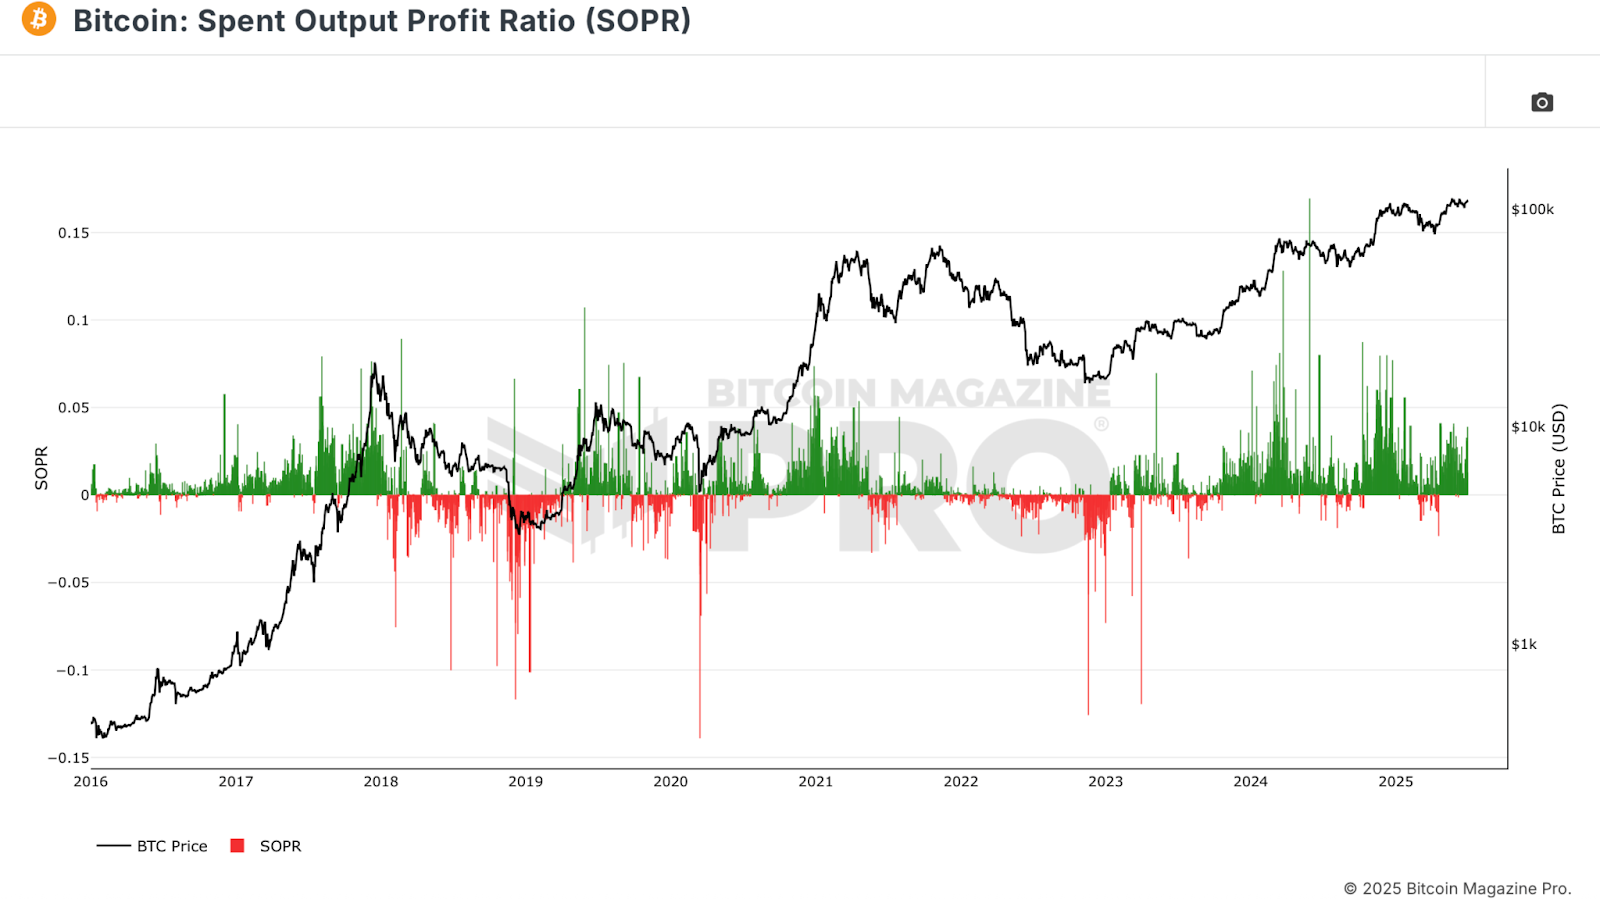
Sharp downward spikes indicate capitulation, investors locking in losses. These often mark fear-driven selloffs and major buying opportunities. Sustained SOPR readings above zero can indicate uptrends, but excessive profit-taking may signal overheated markets.
Conclusion
By layering these metrics: Realized Cap HODL Waves, Puell Multiple, MVRV Z-Score, Funding Rates, and SOPR, investors gain a multidimensional view of Bitcoin market conditions. No single indicator offers all the answers, but confluence across several increases the probability of success. Whether you’re accumulating in a bear market or distributing near a potential top, these free tools can help you remove emotion, follow the data, and dramatically improve your edge in the Bitcoin market.
💡 Loved this deep dive into bitcoin price dynamics? Subscribe to Bitcoin Magazine Pro on YouTube for more expert market insights and analysis!
For more deep-dive research, technical indicators, real-time market alerts, and access to expert analysis, visit BitcoinMagazinePro.com.

Disclaimer: This article is for informational purposes only and should not be considered financial advice. Always do your own research before making any investment decisions.


