

National growth in home values slowed to its weakest pace in 14 years in 2025, as elevated mortgage rates and affordability pressure kept a lid on price growth, according to a key home price index.
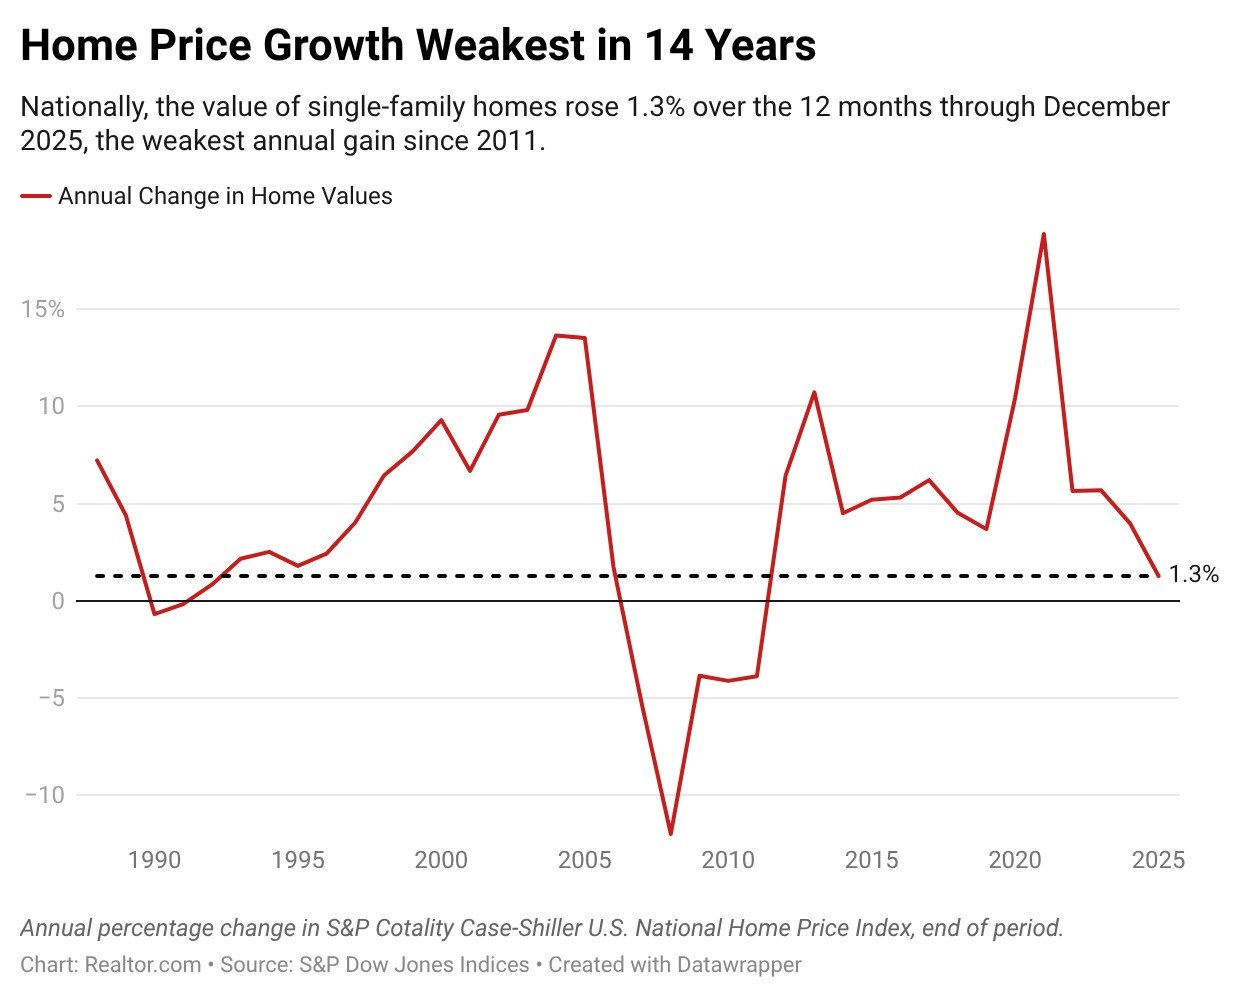
Nationally, the value of single-family homes as measured by repeat transactions rose 1.3% over the 12 months through December, according to data from the S&P Cotality Case-Shiller Index released Tuesday.
It marked the weakest full-year gain since 2011, when home prices fell 3.9%, and came in well below the 6.6% average annual growth rate seen over the past decade.
“Two structural forces have reshaped the market over recent years: mortgage rates and inflation,” says Nicholas Godec, head of fixed income tradables and commodities at S&P Dow Jones Indices.
Mortgage rates averaged 6.6% in 2026, according to Freddie Mac, remaining close to a two-decade high and well above the 3.9% average that prevailed from 2016 through 2020.

Meanwhile, overall inflation for 2025 came in at 2.7%, outpacing growth in home prices and effectively diminishing real home values for most owners.
“This marks a notable reversal: Over the prior decade, national home prices outpaced inflation by 3.7 percentage points annually, a dynamic that has quietly reversed, with real home price returns turning negative in June 2025,” says Godec.
Godec notes that within the annual growth figure, the two halves of 2025 display opposite trends, with prices actually falling in the second half of the year.
“The first six months saw prices rise 2.6%, while the back half delivered nominal declines of 1.3%—and every one of the 20 tracked metro areas posted negative price returns over that same period,” he says.
Home prices continue to fall in the South and West
At the metro level, home price growth remains healthy in many Northeastern and Midwestern markets, while prices are soft or even falling in much of the South and West.
Cities with the largest annual increase in values include Chicago (+5.3%), New York (+5.1%), Cleveland (+4.0%), and Minneapolis (+2.7%).
Meanwhile, the cities with the biggest annual declines in 2025 were Tampa (-2.9%), Denver (-2.1%), Phoenix (-1.5%), Dallas (-1.5%), and Miami (-1.5%).
“This geographic divergence reflects the broader reordering underway: Historically steady Midwest and Northeast markets continued to outperform as Sun Belt markets that surged during the pandemic cycle extended their correction,” says Godec.

Realtor.com® Senior Economist Anthony Smith says that the widening regional divergence reflect a growing gap in inventory levels, with many markets in the South and West now exceeding pre-pandemic supply levels.
“Markets that experienced outsized pandemic-era appreciation are now seeing more persistent normalization as inventory rebuilds and demand remains payment-sensitive,” says Smith.
The Case-Shiller Index reports on a two-month delay and reflects a three-month moving average of home sales prices.
Homes usually go under contract a month or two before they close, so the December data primarily reflects purchase decisions made in the early fall.
Although the Index’s price data is delayed by several months, it is considered one of the best available measures of changing home values, because it is based on repeat transactions on the same properties.


