


Clear visual workflows help teams understand processes faster, and flowchart templates make that easier to build, standardize and reuse across projects, operations and decision-making scenarios in any organization size today.
When to Use Flowchart Templates
Flowchart templates can be applied across many situations where teams need to map processes, clarify responsibilities and improve decision making. From simple task sequences to complex operational workflows, they help structure activities, reduce confusion, identify inefficiencies and support consistent execution across multiple projects, departments and business functions over time in practice.
- Mapping business processes to understand how work flows from start to finish
- Designing standard operating procedures to ensure consistent execution
- Planning project workflows and task sequences before execution begins
- Identifying bottlenecks or inefficiencies in existing processes
- Documenting decision trees for approvals, escalations or compliance steps
- Training new employees by visualizing how tasks and systems connect
- Improving cross-functional collaboration by clarifying handoffs
- Analyzing customer journeys to optimize service or product experiences
Whenever you’re ready to start managing projects, give ProjectManager a try. ProjectManager is an award-winning project management software designed to plan, schedule and track projects from start to finish. Build detailed project schedules, allocate resources, monitor costs and compare estimates against actual performance using a complete set of powerful project management tools. Get started for free today.
This flowchart template for Word includes explanations of key symbols, a practical example showing how workflows are represented and a built-in drawing canvas that makes inserting and connecting shapes easier, something that is otherwise difficult when working from a blank Word page without structured visual support.
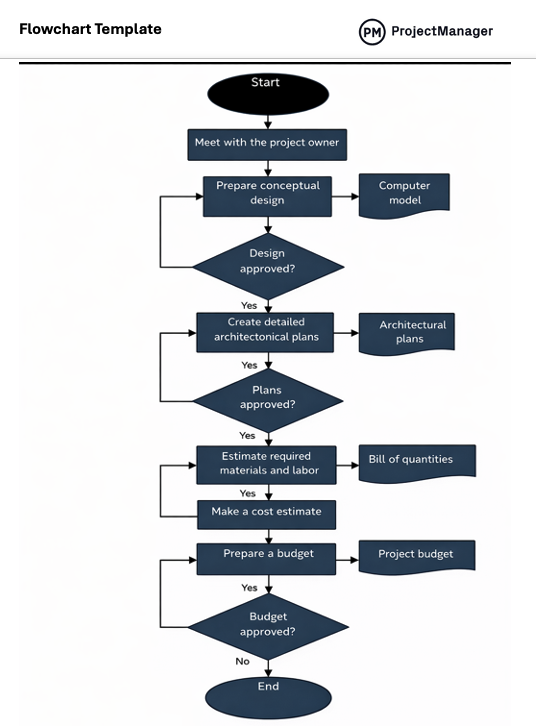
Here’s a quick overview of some of the flowchart symbols included in this free flowchart template for Word. These same symbols can also be used in the other free flowchart templates listed in this blog.
- Oval: Represents the start or end points of a process clearly
- Rectangle: Defines a specific action or task within the workflow sequence
- Diamond: Indicates a branching point where outcomes depend on conditions
- Parallelogram: Shows data entering or leaving the system or process
- Circle: Links different parts of a flowchart across sections or pages
- Arrow: Illustrates the direction of flow between steps in the process
- Document (wavy-bottom rectangle): Represents a document used within workflows
- Double-lined rectangle: Refers to a predefined process defined elsewhere
- Trapezoid: Indicates a step requiring manual input from a user
- Cylinder: Represents structured data storage used or accessed in processes
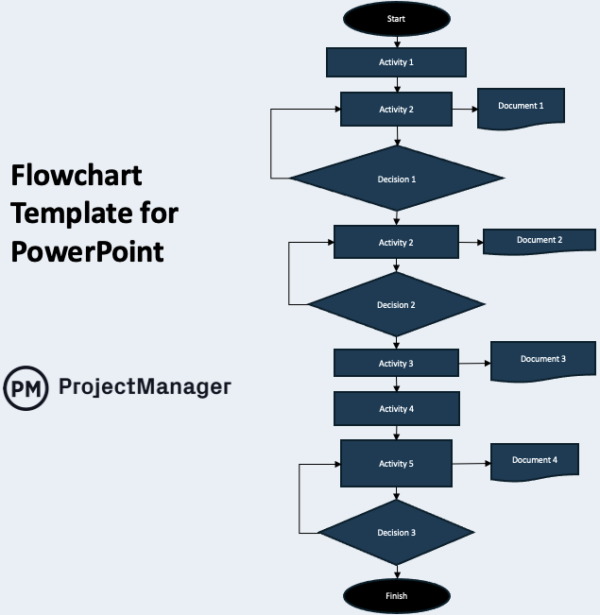
Presentations often require more than text to explain processes, especially when stakeholders need quick clarity. Building a flowchart in PowerPoint allows teams to visually walk through workflows or processes during meetings, and this template simplifies that by providing structured shapes and connections that are ready to edit, rearrange and present without design friction.
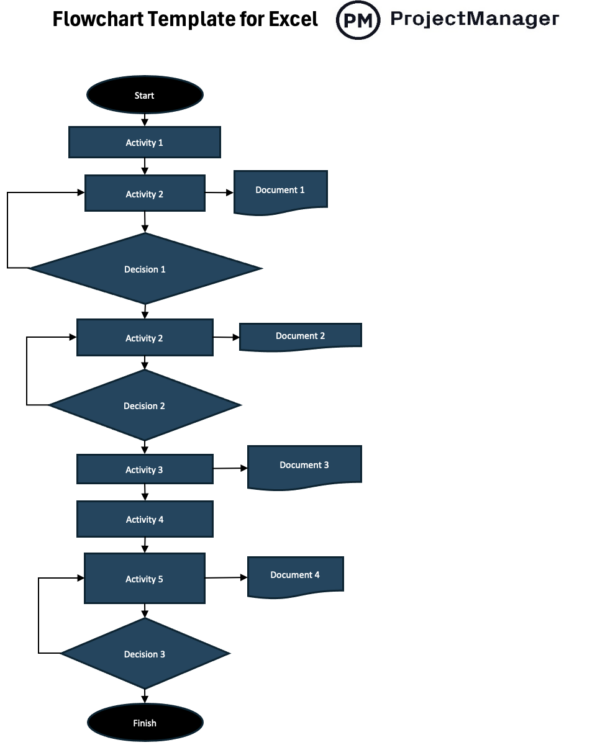
Some workflows are tightly connected to data, calculations or structured tracking, making Excel a practical place to map them. Creating a flowchart in Excel helps align processes with underlying data, and this template adds a visual layer on top of spreadsheets, allowing users to design workflows without disrupting their existing data structure.
A swimlane flowchart is a process mapping diagram that organizes workflow steps into horizontal or vertical lanes, characterized by role-based separation of tasks, often driven by cross-functional processes, and resulting in clearer accountability, improved coordination and better visibility into how responsibilities move across teams or systems during execution.
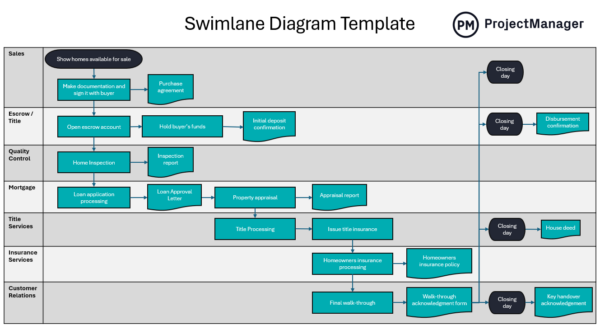
This swimlane flowchart template provides a structured layout where users can assign tasks to specific roles, departments or systems using clearly defined lanes. It includes standard symbols, guidance on placement and connection rules, helping teams map responsibilities, visualize handoffs and identify inefficiencies while keeping complex workflows organized and easy to interpret.
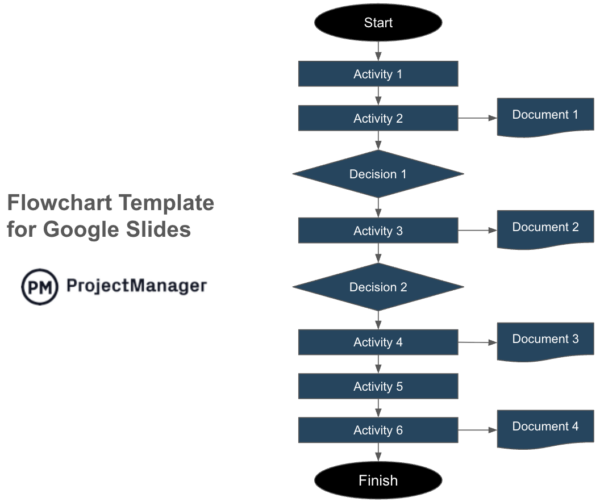
Collaborative environments demand tools that multiple users can access and edit in real time, especially when mapping processes. Creating a flowchart in Google Slides enables shared editing and instant feedback, and this template accelerates that by offering prebuilt structures that teams can quickly adapt without starting from a blank presentation.
ProjectManager Is an Award-Winning Project Management Software
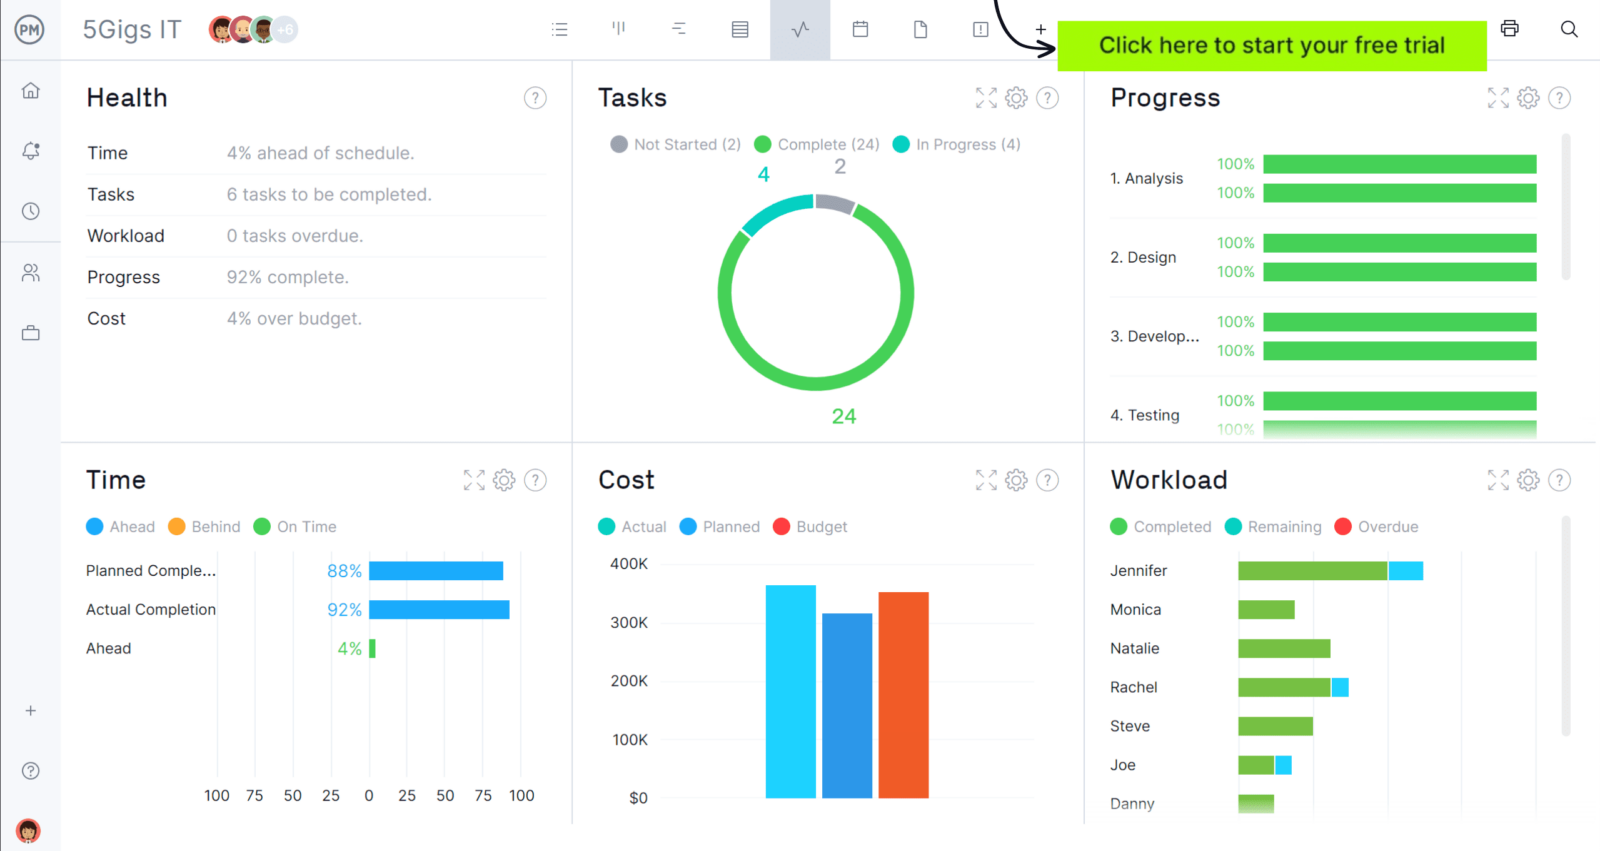
ProjectManager offers robust project management features such as Gantt charts, task lists, workload management charts, timesheets and real-time dashboards and reports. In addition to that, it’s also equipped with AI project insights, online team collaboration features and unlimited file storage that further help project managers ensure nothing falls through the cracks. Watch the video to learn more!
Related Content
If you need a tool to help you manage projects, then signup for our software now at ProjectManager. Our online software helps teams across industries plan, track and oversee projects as they unfold. Sign up for a free 30-day trial today!


