

In Machine Learning, we often work with dataframes without thinking about their underlying mathematical structure. Every dataset can actually be represented using vectors, matrices, and distances, which form the backbone of most algorithms. Unlike typical articles, this blog is based on my handwritten notes, making the concepts easier to follow and visualize. I’ll be sharing the photos of these notes below so you can understand the mathematical foundation of dataframes in a clear and practical way.

A dataframe can be represented mathematically as a collection of rows.
Each row is an ordered pair (xi,yi)(x_i, y_i)(xi,yi), where xix_ixi is a vector of features (independent variables) and yiy_iyi is the target (dependent variable).

Here the target value is discrete (e.g., −1,+1–1, +1−1,+1), which represents a classification problem.
The dataframe given to ML algorithms is mathematically expressed as a matrix of size n×dn \times dn×d.
Since a matrix works only with numerical data, targets may be real-valued (regression) or discrete (classification: {0,1},{−1,+1},{0,1}, {-1,+1},{0,1},{−1,+1}).


Each data point (row) in a dataframe can be represented as a vector.
For 2 features (f1,f2f_1, f_2f1,f2), points like P and Q are shown as column vectors P=[p1,p2]TP = [p_1, p_2]^TP=[p1,p2]T, Q=[q1,q2]TQ = [q_1, q_2]^TQ=[q1,q2]T.
Operations include vector addition, subtraction, and dot product, where the dot product gives a scalar.
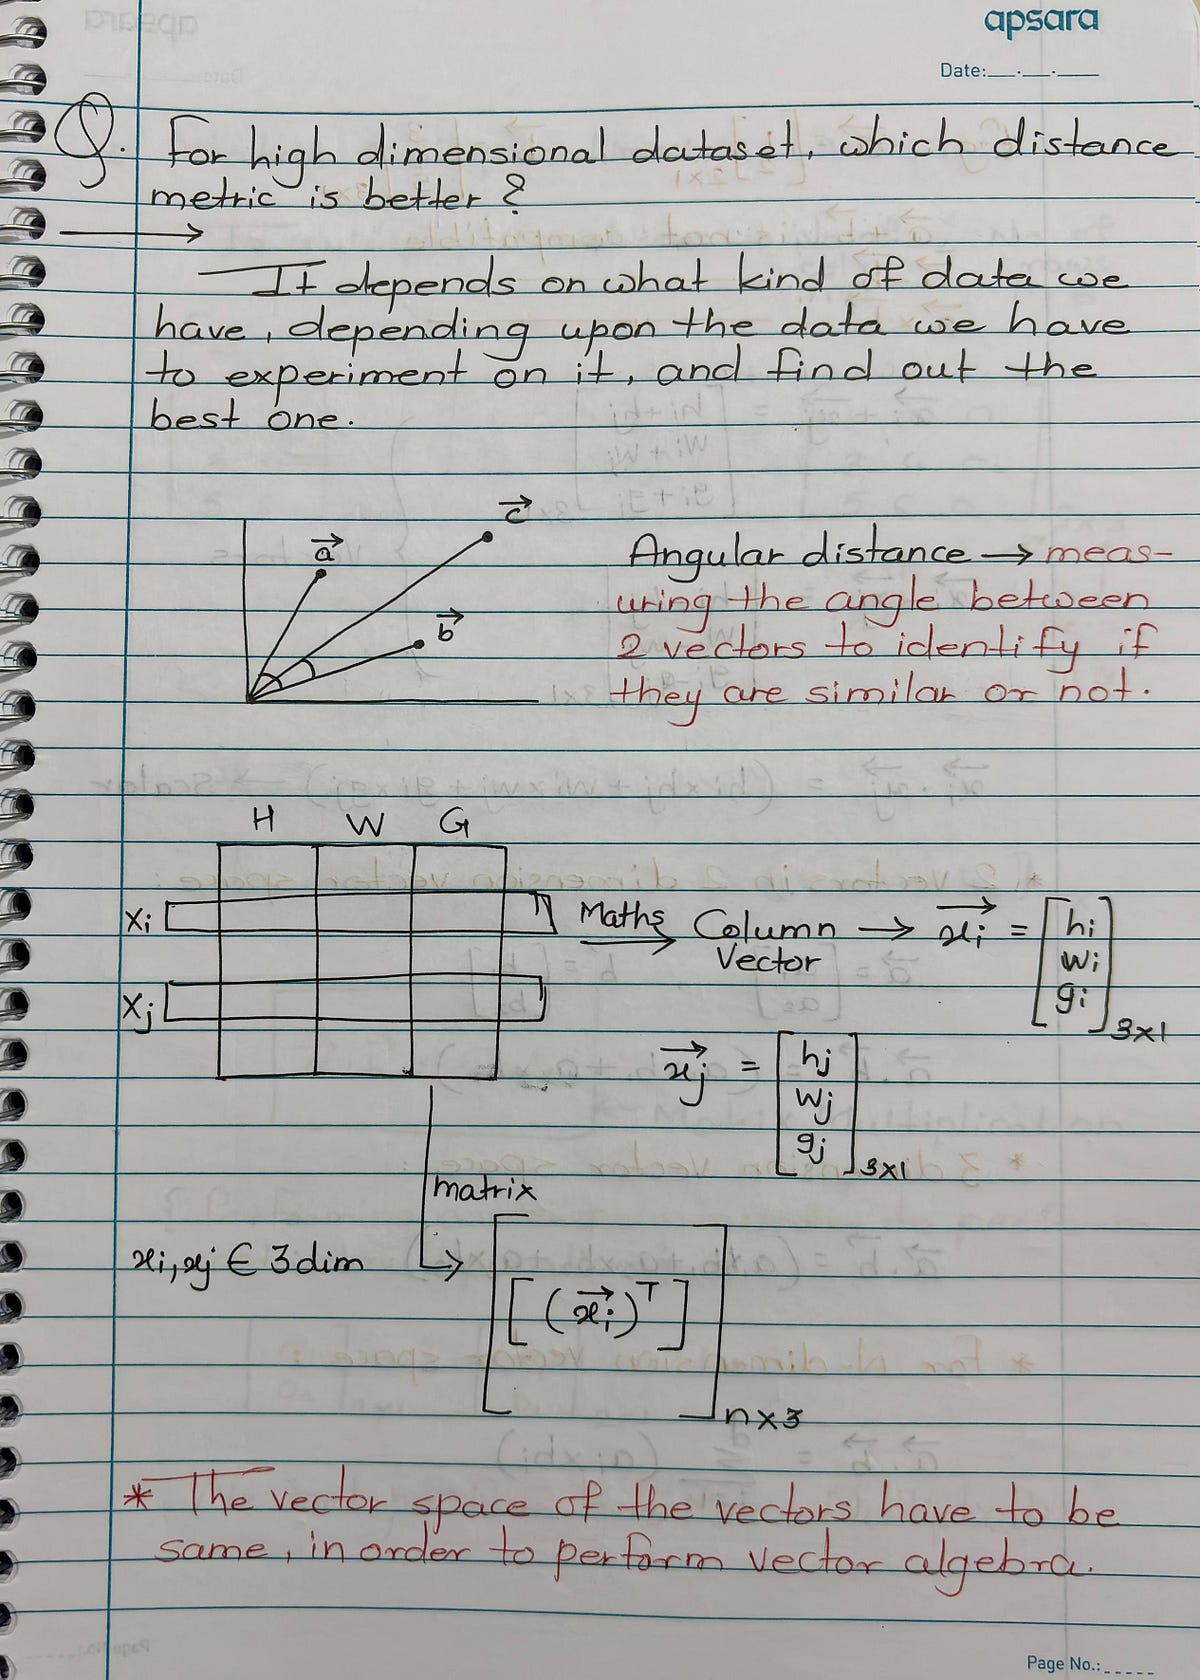
The distance between two vectors is computed using the Euclidean formula.
For 1-dimensional data, vectors reduce to simple scalars, but the same operations (addition, subtraction, dot product) apply.


- For a detailed explanation of distance metrics, you can check out my separate blog where I’ve covered Euclidean, Manhattan, Minkowski, Hamming, Chebyshev, Mahalanobis, and Jaccard in depth.
- Read here :-


Matrix multiplication is possible only when the number of columns in matrix A equals the number of rows in matrix B.
The result has dimensions = (rows of A × columns of B).
An example shows a 3×23 \times 23×2 matrix multiplied by a 2×32 \times 32×3 matrix, giving a 3×33 \times 33×3 product.
For vectors, multiplication is written as dot product: a⃗⋅b⃗=aTb\vec{a} \cdot \vec{b} = a^T ba⋅b=aTb.
If dimensions don’t align (e.g., two 2×12 \times 12×1 column vectors), multiplication is not possible without a transpose.


- Vectors represent individual data points or rows in a dataframe. They allow operations like addition, subtraction, dot product, and distance calculation.
- Matrices represent the entire dataset, with rows as observations and columns as features/targets. Matrix multiplication is valid only when dimensions align.
- Distances (like Euclidean) measure how far two vectors (data points) are from each other, forming the basis for many ML algorithms.
Together, these concepts build the mathematical foundation of dataframes, helping us understand how machine learning algorithms interpret data.
Thanks for reading, and I hope you enjoyed this different way of learning — with less reading and more handwritten notes to make concepts clearer.

