


Throughout the life of a project, project managers check in on progress and compare it to the project plan—comparing their predictions to reality. If they don’t do this regularly, odds are the budget will suffer and their project will fail. Luckily, these deviances from the plan, such as cost variance, don’t have to sink a project.
In fact, they can strengthen it. The key is spotting them and making adjustments to stay on the right path. One of the best ways to avoid cost overrun is by calculating cost variance.
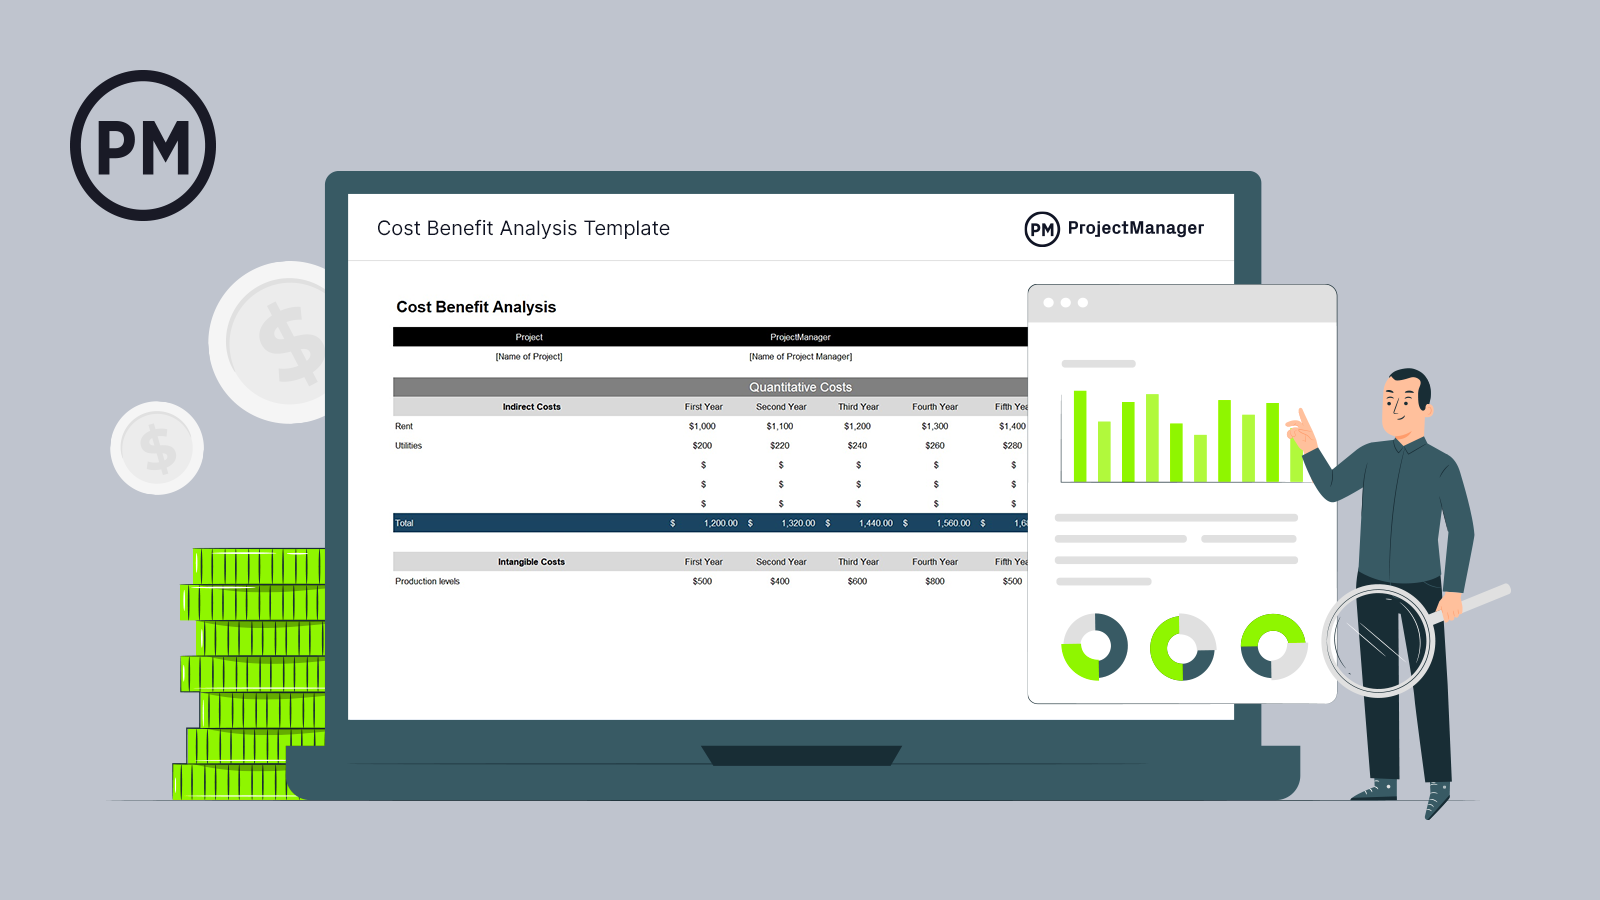
Get your free
Cost Benefit Analysis Template
Use this free Cost Benefit Analysis Template for Excel to manage your projects better.
What Is Cost Variance in Project Management?
Cost variance (also referred to as CV) is the difference between project costs estimated during the planning phase and the actual costs. In other words, it’s how much actual costs vary from budgeted costs. Calculating cost variance is how project managers track expenses to see if a project is under or over budget.
These calculations are part of a technique called earned value management (EVM). In an EVM system, the goal of cost management is to establish whether a variance is positive, negative or zero.
When project managers have this earned value analysis information, they can make the necessary adjustments to stay on track. If a variance is extremely high (negative), changes need to be made. If there’s an extremely low-cost variance (positive) or zero variance, they can take it as a sign of effective cost management.
Positive Cost Variance vs. Negative Cost Variance
Cost variance (CV) is a key performance metric in project management that measures the difference between the budgeted cost of work performed (earned value) and the actual cost incurred. It helps project managers assess whether a project is under or over budget.
Positive cost variance indicates that the project is under budget. This happens when the earned value is greater than the actual cost. For example, if your project has earned $50,000 worth of work but you’ve only spent $45,000, your cost variance is +$5,000. A positive CV suggests efficient cost management and resource use.
Negative cost variance means the project is over budget. This occurs when the actual cost exceeds the earned value. For instance, if you’ve completed $40,000 worth of work but spent $45,000, your cost variance is -$5,000. A negative CV flags potential issues such as scope creep, underestimation, or misallocated resources, and usually requires corrective action.
Understanding and tracking cost variance is crucial for maintaining financial control and ensuring project profitability.
How to Calculate Cost Variance in Project Management
Cost variance is exactly how much a project is over or under budget. This is calculated using the cost variance formula.
Cost Variance Formula
In the earned value management (EVM) methodology used in project management, cost variance (CV) measures the difference between the value of work performed and the actual cost incurred.
It is calculated using the formula below, where EV stands for earned value and AC is actual cost. A positive CV indicates under budget; a negative CV signals cost overruns.
Cost Variance (CV) = Earned Value (EV) – Actual Cost (AC)
- Actual Cost (AC): The total cost incurred for work performed on a project up to a specific point. It includes all direct and indirect expenses, such as labor, materials, and equipment, regardless of the project’s progress.
- Earned Value (EV): The budgeted value of the work actually completed at a given point in time. It reflects project progress in monetary terms and is used to compare planned versus actual performance.
Cost Variance Calculation Methods
Cost variance calculation methods are techniques used to measure the difference between a project’s planned and actual costs at various points in time.
There are three main cost variance calculation methods, cumulative cost variance method, period-by-period cost variance method and variance at completion method.
These three methods apply the cost variance formula (CV = EV – AC) at different stages of the project.
Cumulative Cost Variance Method
The cumulative cost variance (CV) method calculates the difference between the earned value (EV) and actual cost (AC) of a project up to a specific point in time. It reflects the overall cost performance across the entire project duration to date.
Formula: CV = EV – AC
This method provides a high-level overview of whether the project is under or over budget, making it useful for ongoing budget tracking and trend analysis. It helps stakeholders assess long-term project performance rather than isolated cost issues.
Period-by-Period Cost Variance Method
The period-by-period cost variance method focuses on short time intervals—typically weekly or monthly—calculating the cost variance for each specific period.
Formula (per period): CV = EV (for the period) – AC (for the period)
This method allows project managers to pinpoint when cost deviations occur, offering a more detailed and immediate insight into spending issues. It’s ideal for identifying short-term trends or sudden spikes in costs that may not yet be reflected in cumulative data.
Variance at Completion (VAC) Method
Variance at completion (VAC) forecasts the expected cost variance at the end of the project. It compares the total project budget, known as the budget at completion (BAC), with the forecasted cost, or estimate at completion (EAC).
Formula: VAC = BAC – EAC
This method helps project managers anticipate whether they are likely to complete the project under or over budget, enabling better long-term financial planning and corrective action before project closure.
What Are the Main Causes of Cost Variance In Project Management?
Cost variance in project management refers to the difference between the estimated cost and the actual cost of a project. While small variances are expected, significant differences often signal deeper issues that can affect project success. Understanding the root causes of cost variance is essential for controlling budgets, managing expectations and delivering value.
Inaccurate Cost Estimates
Poor initial cost estimates can derail a project’s financial trajectory from the start. This usually occurs when estimates are based on incomplete data, guesswork, or overly optimistic assumptions. Without thorough research and expert input, budget baselines may not reflect the true scope or complexity of the work.
Scope Creep
When new features, tasks or deliverables are added to a project without corresponding budget adjustments, it leads to scope creep. This often results from unclear requirements or lack of change control processes. The more the scope expands, the more costs rise—often unexpectedly.
Schedule Delays
Delays in project timelines can significantly increase costs due to extended resource use, contract penalties or the need to accelerate later work phases. Time-sensitive costs like equipment rentals or staff salaries often become inflated when a project runs behind schedule.
Resource Cost Fluctuations
The price of labor, materials and subcontractor services can change due to market conditions, availability or external economic factors. If a budget doesn’t account for potential price shifts or inflation, it can cause substantial cost overruns.
Project Risks
Unexpected events such as regulatory changes, weather delays or technical issues can disrupt progress and incur additional costs. Without a robust risk management plan, projects may struggle to absorb the financial impact of such events.
Low Productivity or Resource Utilization Inefficiency
When teams aren’t operating efficiently—due to poor training, unclear direction or lack of coordination—project tasks take longer and require more resources. Inefficient resource usage drives up labor costs and affects overall cost performance.
Cost Variance Analysis Examples
To better understand the concept of cost variance analysis we have created an example in a couple of different industries. This should help to show how the process works in a real-life scenario.
Construction Cost Variance Analysis Example
This cost variance analysis example is for the construction industry. Here, the project is working on the foundation of an office building.
Project: Office Building Construction
Task: Foundation Work
- Planned Value (PV): $80,000
- Earned Value (EV): $75,000
- Actual Cost (AC): $90,000
CV = $75,000 – $90,000 = –$15,000
Analysis: The foundation work is $15,000 over budget. Although 75 percent of the work has been completed (EV), actual spending exceeded expectations due to unforeseen soil stabilization issues and higher-than-estimated concrete costs. This unfavorable variance highlights a need to revise cost estimates for future phases and assess vendor pricing accuracy.
Manufacturing Cost Variance Analysis Example
In this cost variance analysis example, we’re dealing with a manufacturing company. They have a run of steel frames that require welding and assembly.
Project: Production of 500 Steel Frames
Task: Welding and Assembly
- Planned Value (PV): $60,000
- Earned Value (EV): $55,000
- Actual Cost (AC): $50,000
Cost Variance (CV) = EV – AC
CV = $55,000 – $50,000 = +$5,000
Analysis: The welding and assembly task is $5,000 under budget. Although only 92 percent of the planned work has been completed, the actual cost came in lower due to higher labor efficiency and a bulk discount on welding supplies. This favorable variance suggests strong production performance and potential to reallocate savings to later stages.
Understanding Project Costs
All projects cost money, regardless of their size, scope or deliverables. We’ve all heard “there’s no such thing as a free lunch.” The same goes for projects – there’s no such thing as a project without costs. These costs come in many different forms, from the cost of materials to simply the cost of doing business (rent, salaries, etc.). It’s the project manager’s job to take all of these costs into account and create a flexible budget.
Project costs, no matter the type, need to be properly managed and tracked throughout the life cycle of a project. If project managers don’t keep a close eye on the project, it can be detrimental to the project’s success. Plus, having real-time data access is essential to helping project managers make adjustments.
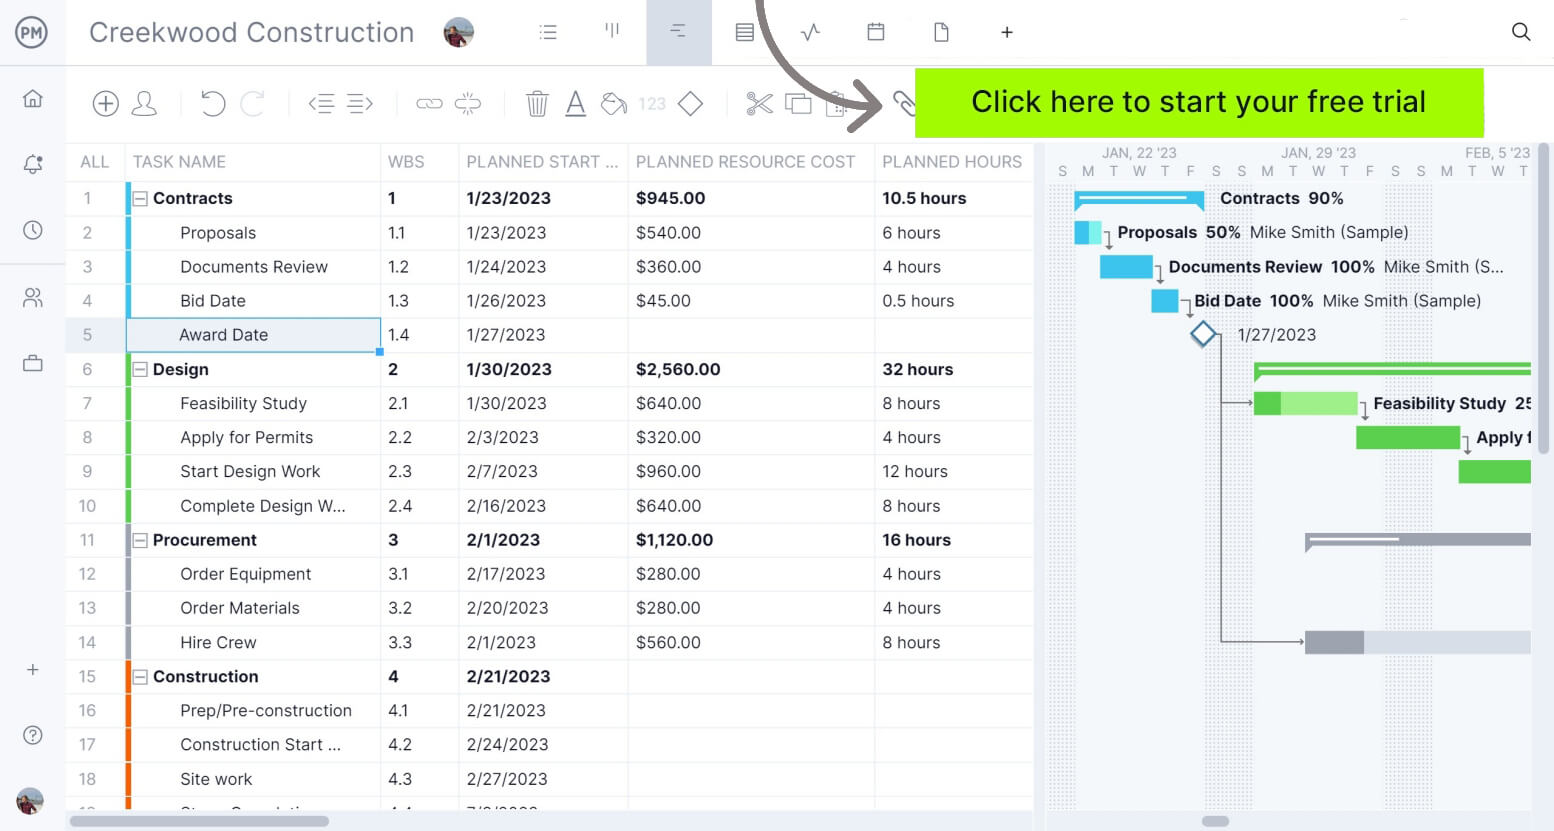
Project management software is foundational in planning and tracking project costs. ProjectManager is award-winning project management software that has the resource-focused tools you need to compare your planned and actual costs in real time. Use our in-depth Gantt chart to set a baseline once you’ve scheduled your tasks, costs and resources. Use it to understand your project costs at a glance and make adjustments as needed in real time.
Different Types of Project Costs
To fully understand project cost variance, it’s helpful to be familiar with the main types of project costs. Take a look at the four you’re most likely to see. Most projects have all four, and each can contribute to overall cost variance:
- Direct Costs: Think of direct costs as costs that go straight to the project to achieve deliverables. A helpful example of a direct cost is the cost of the material needed to build something. The cost of these materials is going toward creating an end product.
- Indirect Costs: Indirect costs, on the other hand, go toward funding “behind the scenes” expenses incurred throughout the life of a project. They’re also known as overhead costs. For example, the cost of renting an office space is a common expense fixed overhead. This expense must be paid to complete the project, but it also goes toward supporting other projects.
- Fixed Costs: Fixed costs are expenses with set prices that aren’t subject to any kind of change. These are dependable costs that will not fluctuate and potentially throw off a budget. Both direct and indirect costs can also be fixed costs (or variable costs). A fixed cost, for example, might look like the flat fee a contractor charges for their services.
- Variable Costs: Variable costs, on the other hand, are not as predictable. For example, the cost of equipment rental may go up or down depending on the vendor, the demand or how long the equipment is needed.
- Overhead Costs: Overhead costs are indirect expenses required to run a project or business, such as utilities, rent, and administrative salaries. They support operations but aren’t tied to specific deliverables or tasks.
Related: Free Project Budget Template for Excel
Other Types of Cost Variance In Project Management and Cost Accounting
Besides the cost variance formula that’s used in earned value management, there are other types of cost variance that are used in project management and cost accounting, especially in manufacturing and construction projects.
Material Cost Variance (MCV)
Material cost variance (MCV) is a key metric in cost accounting and project management used to measure the difference between the expected cost of materials (based on standard costs) and the actual cost incurred.
MCV is most useful in manufacturing and construction projects where material expenses make up a significant portion of the total cost. It helps managers identify pricing issues, supplier performance problems, procurement inefficiencies or market-driven cost changes.
Material Cost Variance Formula
MCV = (SQ × SP) – (AQ × AP)
- SQ= Standard Quantity
- SP= Standard Price
- AQ= Actual Quantity
- AP= Actual Price
Labor Cost Variance (LCV)
Labor cost variance (LCV) is a project and cost management metric that measures the difference between the standard cost of labor and the actual labor cost incurred during a project or production cycle.
LCV is especially important in labor-intensive industries such as construction, manufacturing, and service-based projects. It is used to monitor efficiency, wage rate fluctuations and workforce productivity.
Labor Cost Variance Formula
LCV = (SH × SR) – (AH × AR)
- SH= Standard Hours
- SR= Standard Rate
- AH= Actual Hours
- AR= Actual Rate
Overhead Cost Variance
Overhead cost variance is a financial metric used to assess the difference between the budgeted (or standard) overhead costs and the actual overhead costs incurred during a project or production period.
This metric is particularly useful in environments with fixed budgets and recurring indirect costs, such as in manufacturing plants or large-scale infrastructure projects. Overhead cost variance helps managers understand how well they are controlling indirect spending and can highlight inefficiencies like underutilized facilities, inaccurate cost allocation methods, or unexpected increases in overhead expenses.
Variable Overhead Variance Formula
VOHV = (SH × SR) – (AH × AR)
- SH= Standard Hours
- SR= Standard Rate
- AH= Actual Hours
- AR= Actual Rate
Fixed Overhead Variance Formula
FOHV = Budgeted Fixed Overhead – Actual Fixed Overhead
Other Cost Variance Analysis Formulas Used in EVM
While the formula explained above is the main one used to calculate cost variance in project management, there are other earned value management (EVM) formulas that can help with cost variance analysis.
Cost Performance Index Formula
Cost Performance Index (CPI) = Earned Value (EV) / Actual Cost (AC)
A cost performance index (CPI) is a metric used to judge how well resources are being used in a project. When solving for a CPI, the value will be one of two things:
Less than or equal to 1 (resources are not being used efficiently)
Greater than or equal to 1 (resources are being used efficiently)
To solve for CPI, you must divide the earned value by actual costs.
To Complete Cost Performance Index Formula
To Complete Cost Performance Index (TCPI) = (Total Budget – EV) / (Total Budget – AC)
Solving for a complete cost performance index (TCPI) is extremely helpful, especially if you’re experiencing a high (negative) project cost variance. A TCPI is an index that shows how resources must be used for the rest of a project to come in under or on budget.
To find your TCPI, begin by subtracting your earned value from your total budget. Then, subtract your actual cost from the total budget. Last, divide the first quotient by the second quotient.
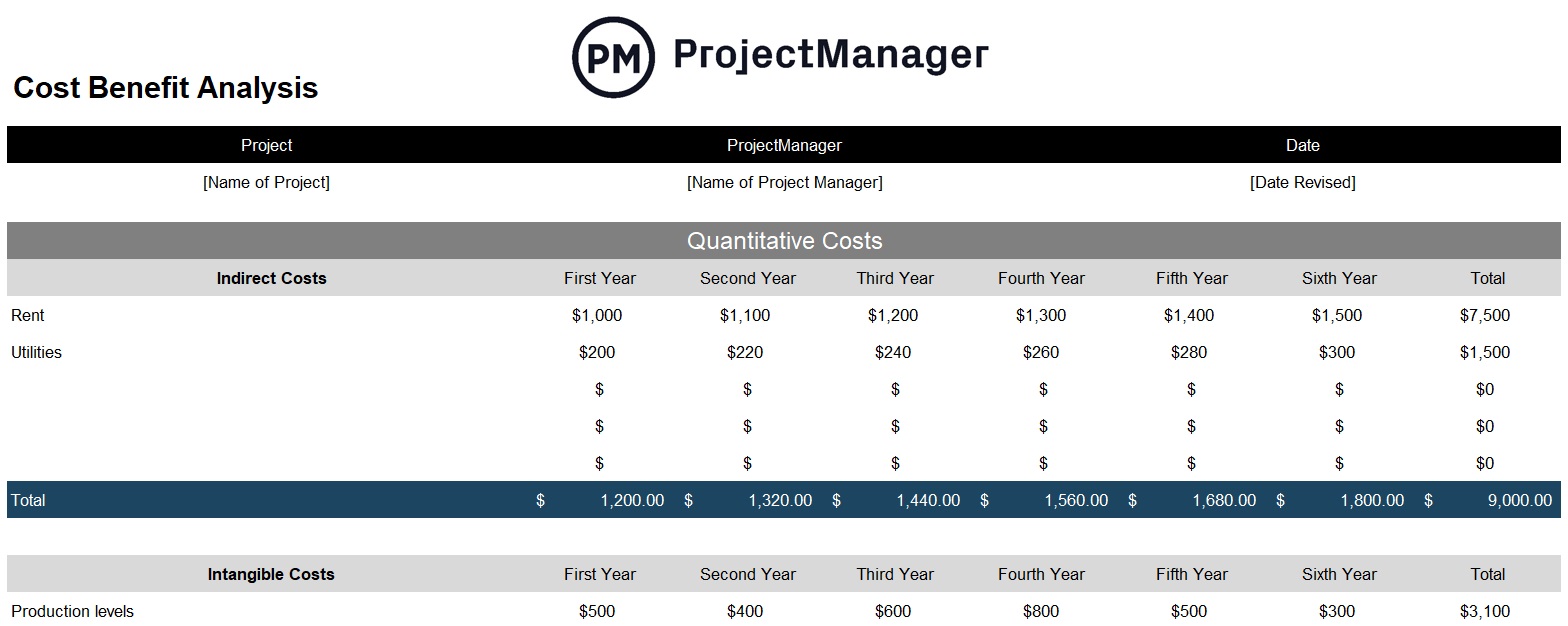
Free Cost Benefit Analysis Template
Before cost variance comes into play, you need to determine if the project expenses are justified. Download our free cost-benefit analysis template for Excel to quickly crunch the numbers and determine if the project makes sense from a cost perspective. Access to this data makes it easy for project managers to determine if a project will be successful.
How ProjectManager Helps Calculate Cost Variance in Real Time
Throughout the life of a project, you’ll want to have each of these cost variance formulas at your disposal. Thankfully, there are cost management tools that make keeping your eye on variances effortless so that you don’t have to manually crunch the numbers.
ProjectManager fills formulas with the correct values automatically and prevents any human error that can lead to major budgeting mistakes. Factors like total budget, actual costs, earned values and more are updated in real-time so that you’re always seeing the most current data.
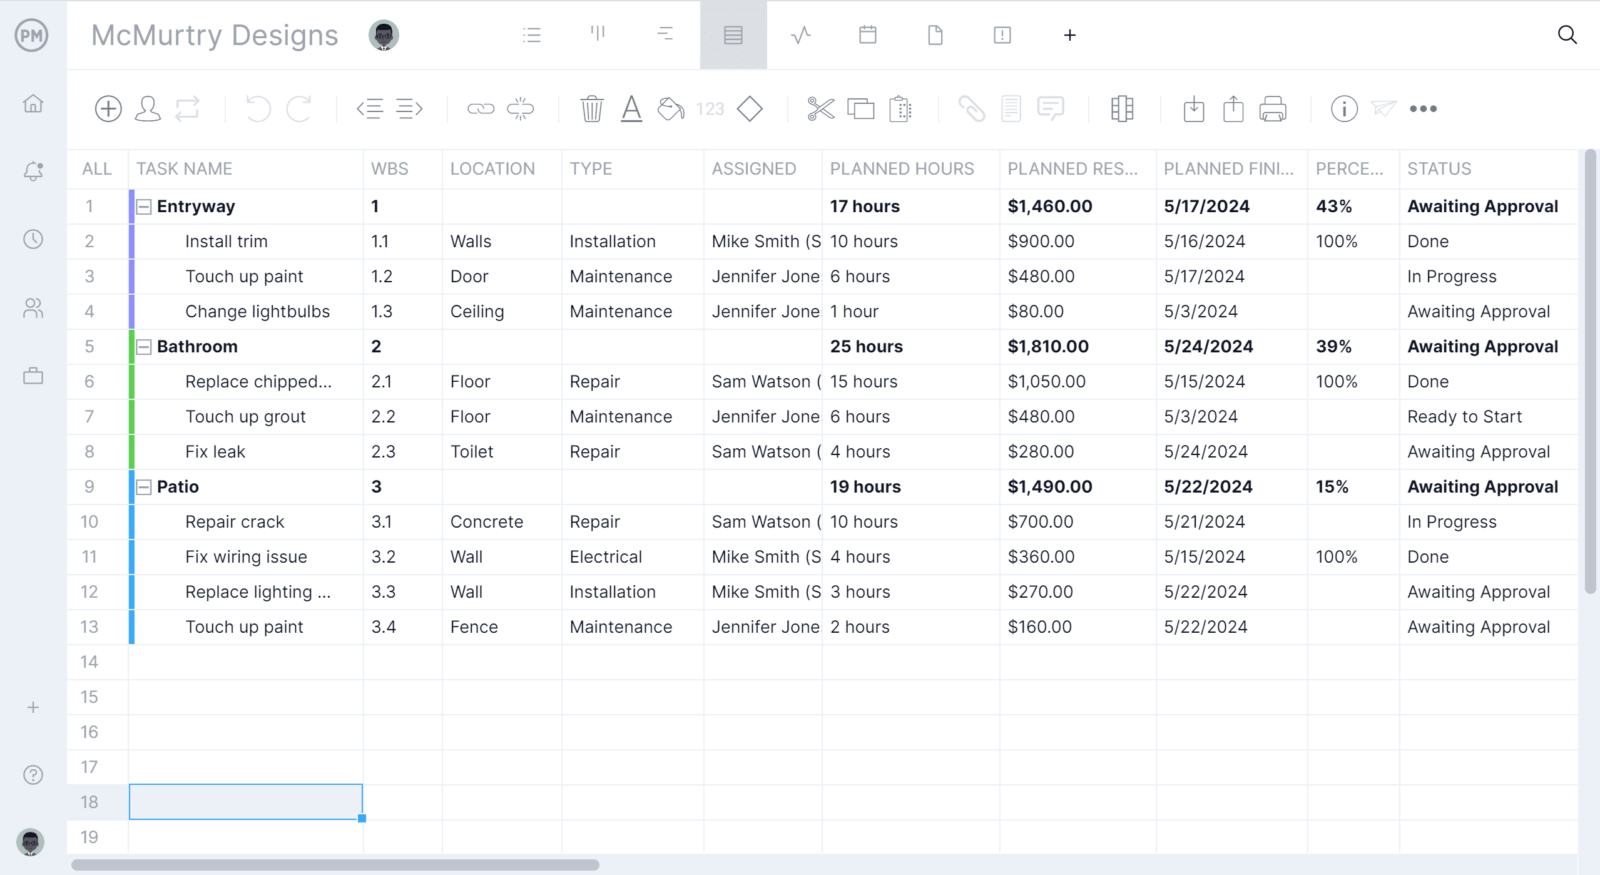
Create and manage project budgets, as well as see how actual costs compare to planned costs on the project dashboard. The ProjectManager project dashboard updates automatically, so you’re always looking at the most current figures and make the smartest budgeting decisions. This makes all the difference between spotting cost variances and missing crucial details. Keep your eye on cost baselines, as well as spending and where projects are at in terms of budget.
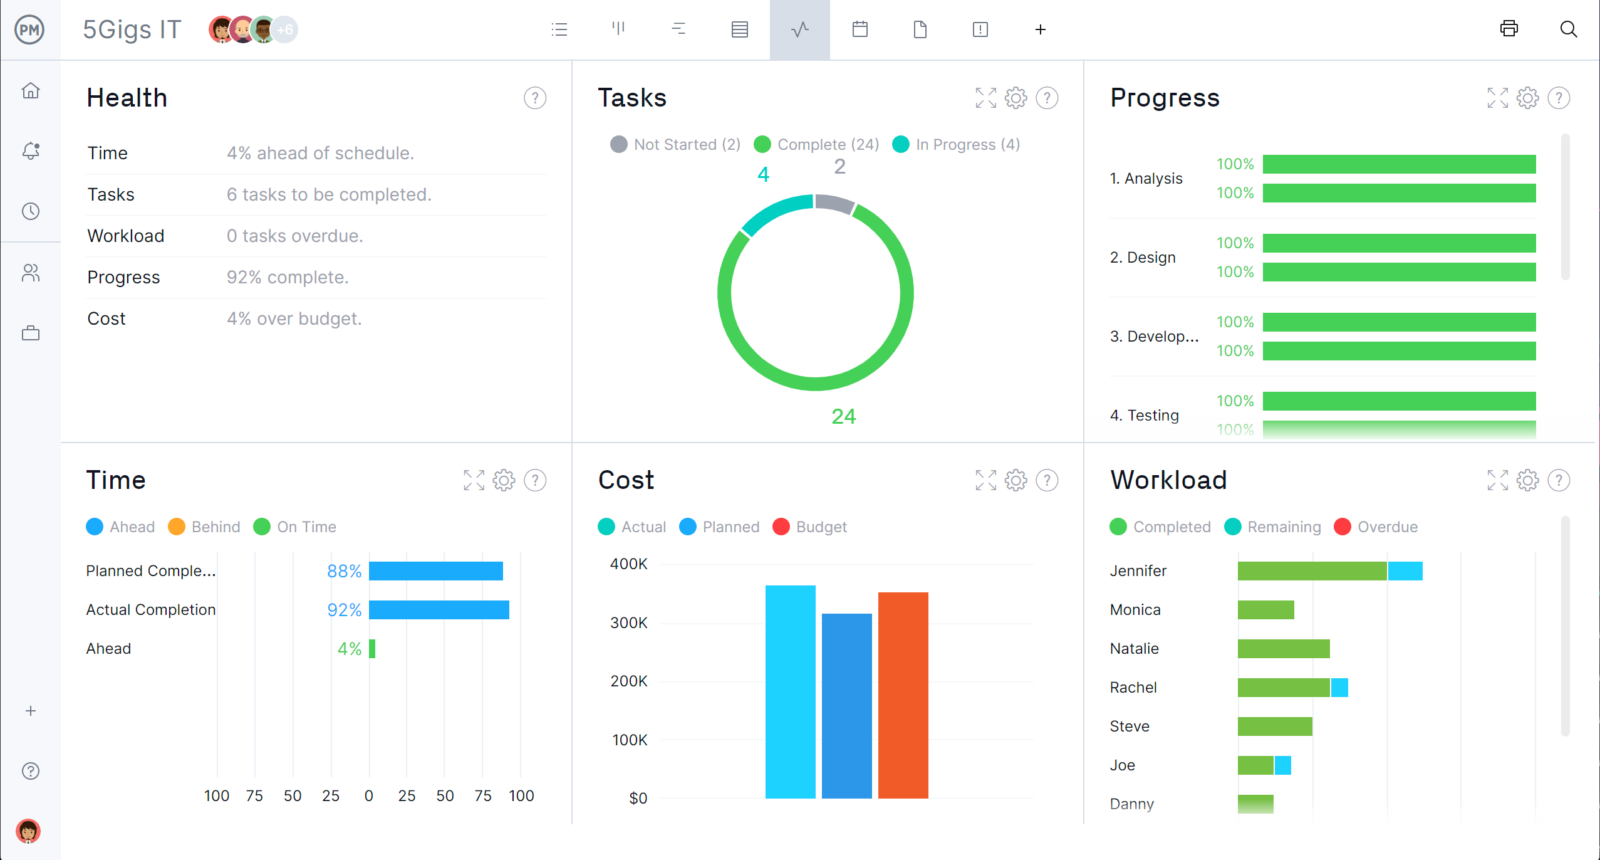
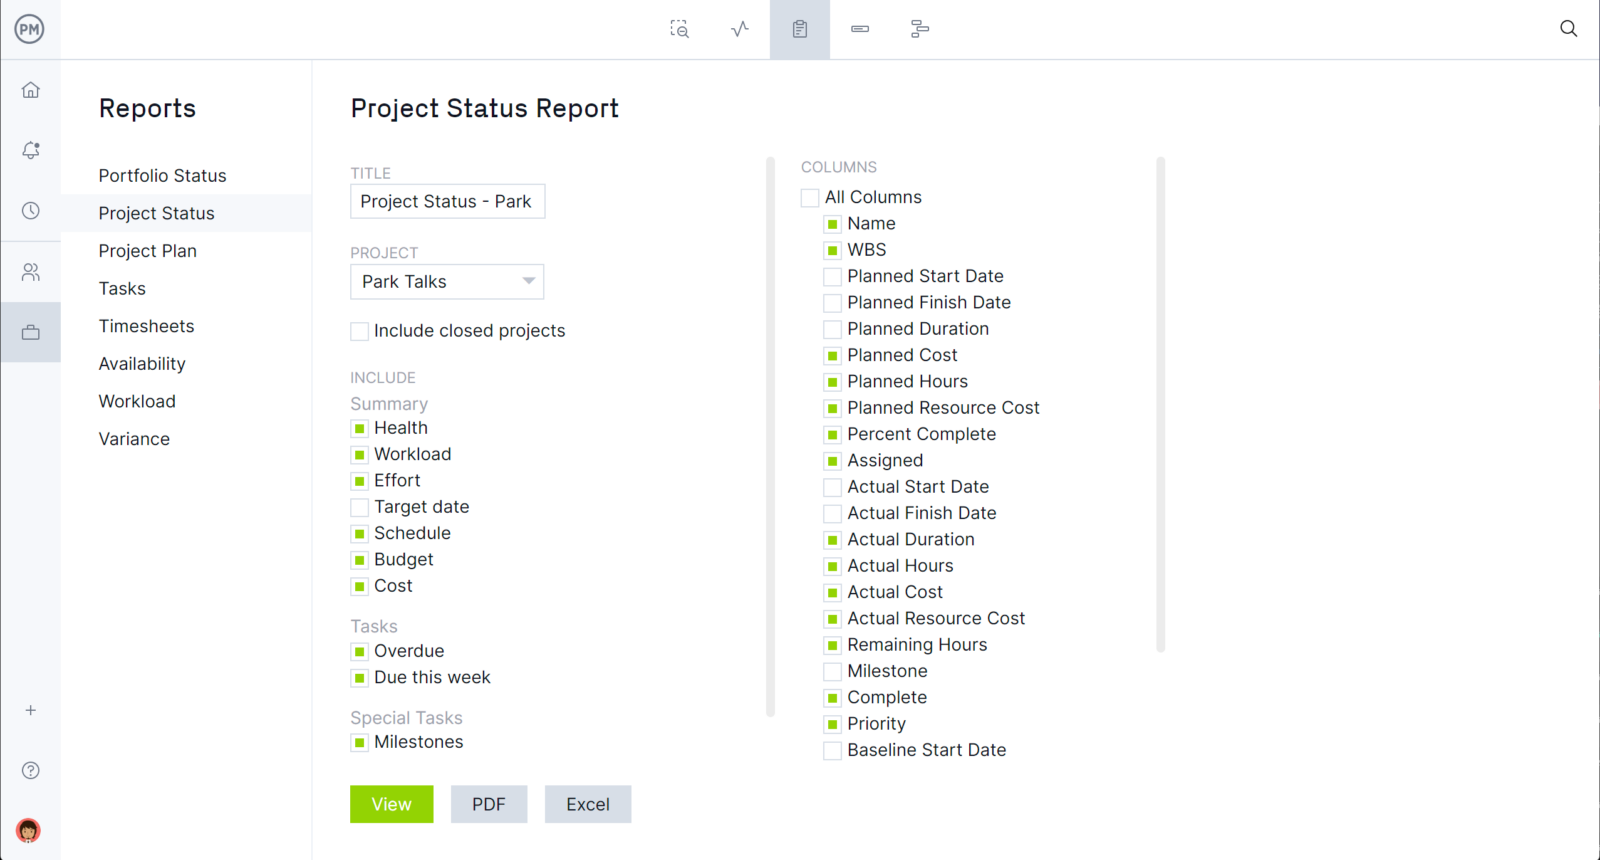
Need to share this information with stakeholders? Create a budget report in only a few clicks to keep the team up to speed and making the best decisions together. Having this information at your fingertips and being able to share it is the difference between projects staying on budget and going over budget, which can result in cost overrun and total failure.
Calculating cost variance requires project management software robust enough to calculate and organize your data in real time. ProjectManager is online project management software that keeps your project’s costs within budget. Try it today with this free 30-day trial.


