


Creating a CPM network starts with listing all the tasks required to complete a project and determining the sequence and dependencies between them. Each task is represented as a node or box in the diagram, and arrows indicate the logical flow from one activity to the next. By mapping out these connections, a CPM network diagram helps project managers visualize the full scope of work and identify the relationships that define the project’s duration.
To build a critical path network diagram, assign estimated durations to each task and use the dependencies to calculate the earliest and latest start and finish times. This process highlights the critical path network—the sequence of tasks that cannot be delayed without affecting the entire project. With a well-structured CMP network diagram, teams can prioritize high-impact activities and allocate resources to keep the project on schedule.
What Is a CPM Network Diagram?
A CPM network diagram, or critical path method network diagram, is a visual representation of a project’s activities and the sequence in which they must be performed to complete the project efficiently. Each task is displayed as a node, and arrows between nodes indicate dependencies. By analyzing the network, project managers can calculate the longest path of dependent tasks—known as the critical path network—which determines the shortest time required for the project to be completed. Any delay in these critical tasks will directly delay the project, making them essential to monitor closely.
The CPM network diagram also helps identify non-critical tasks that have scheduling flexibility or “float.” These insights are vital for effective resource planning, risk mitigation and timeline management. A critical path network diagram gives stakeholders a clear view of which activities require priority attention and which can be shifted without impacting overall delivery. By visually organizing tasks and their dependencies, a CMP network diagram supports informed decision-making and better communication among teams and leadership.
Project management software simplifies the process of creating and managing a CPM network by automating calculations and dynamically adjusting timelines as changes occur. It enables users to input tasks, set durations and dependencies, and instantly visualize the critical path network. As project conditions evolve, software can recalculate timelines, highlight delays and help teams reprioritize. Built-in collaboration tools and real-time updates ensure that all stakeholders are aligned and working from the most accurate project plan.
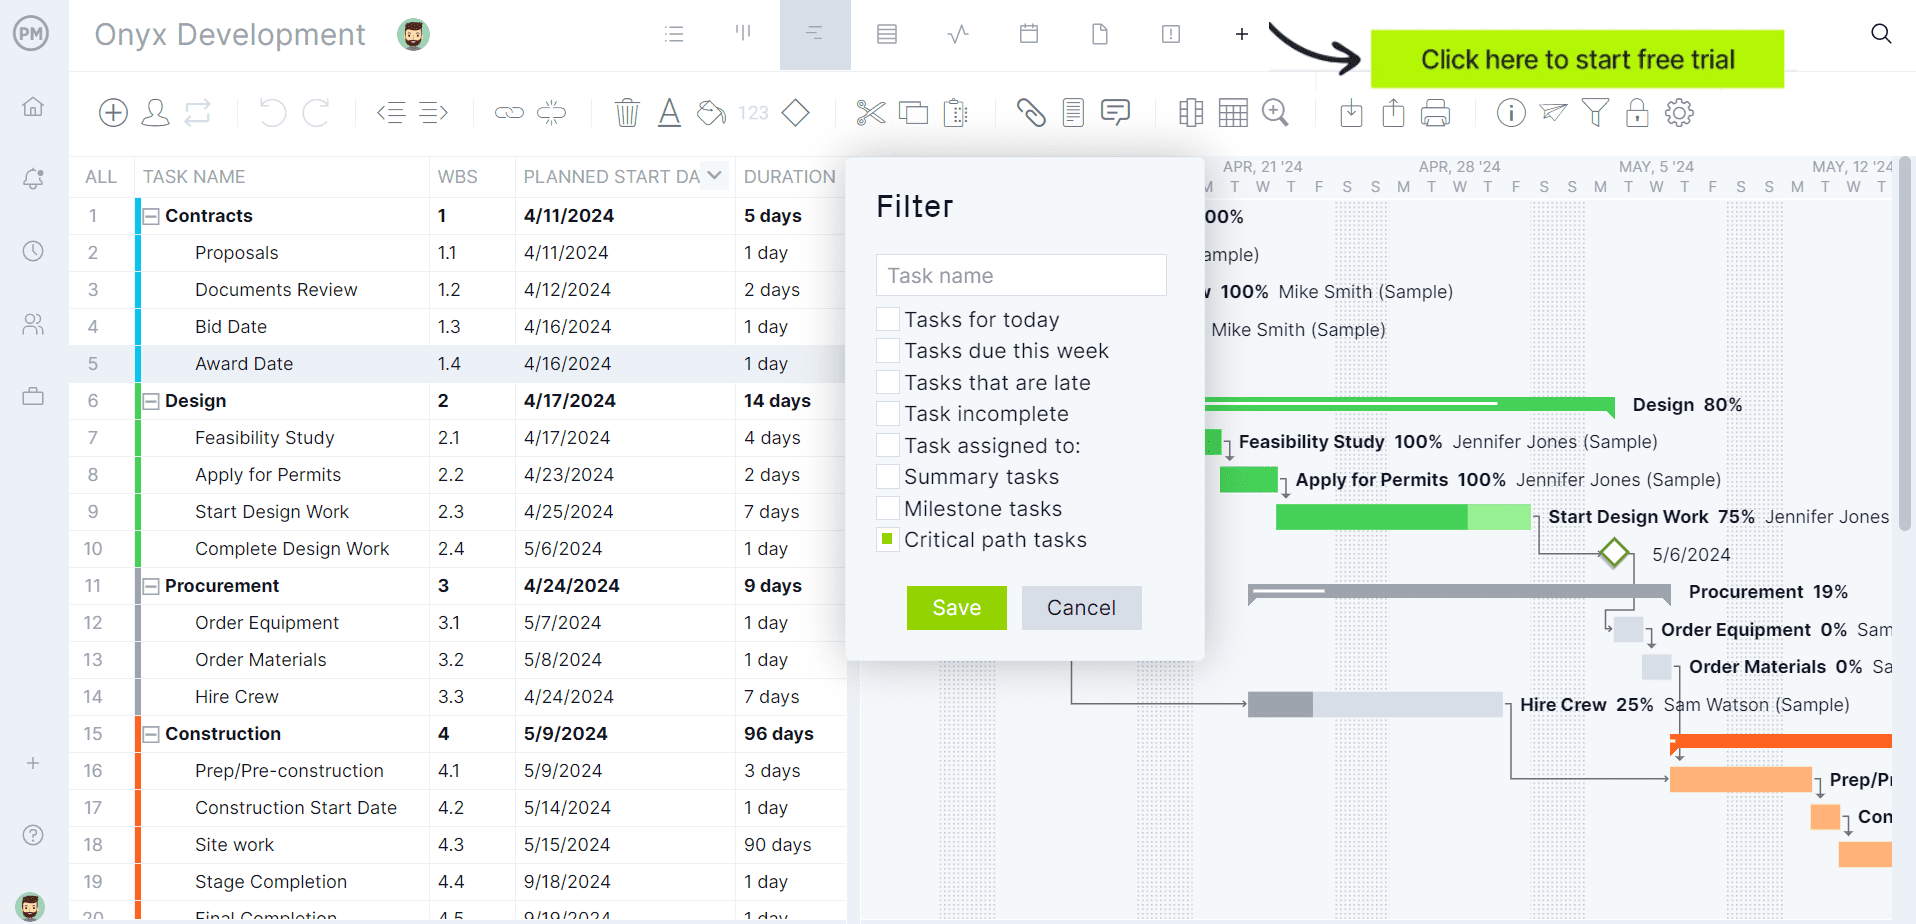
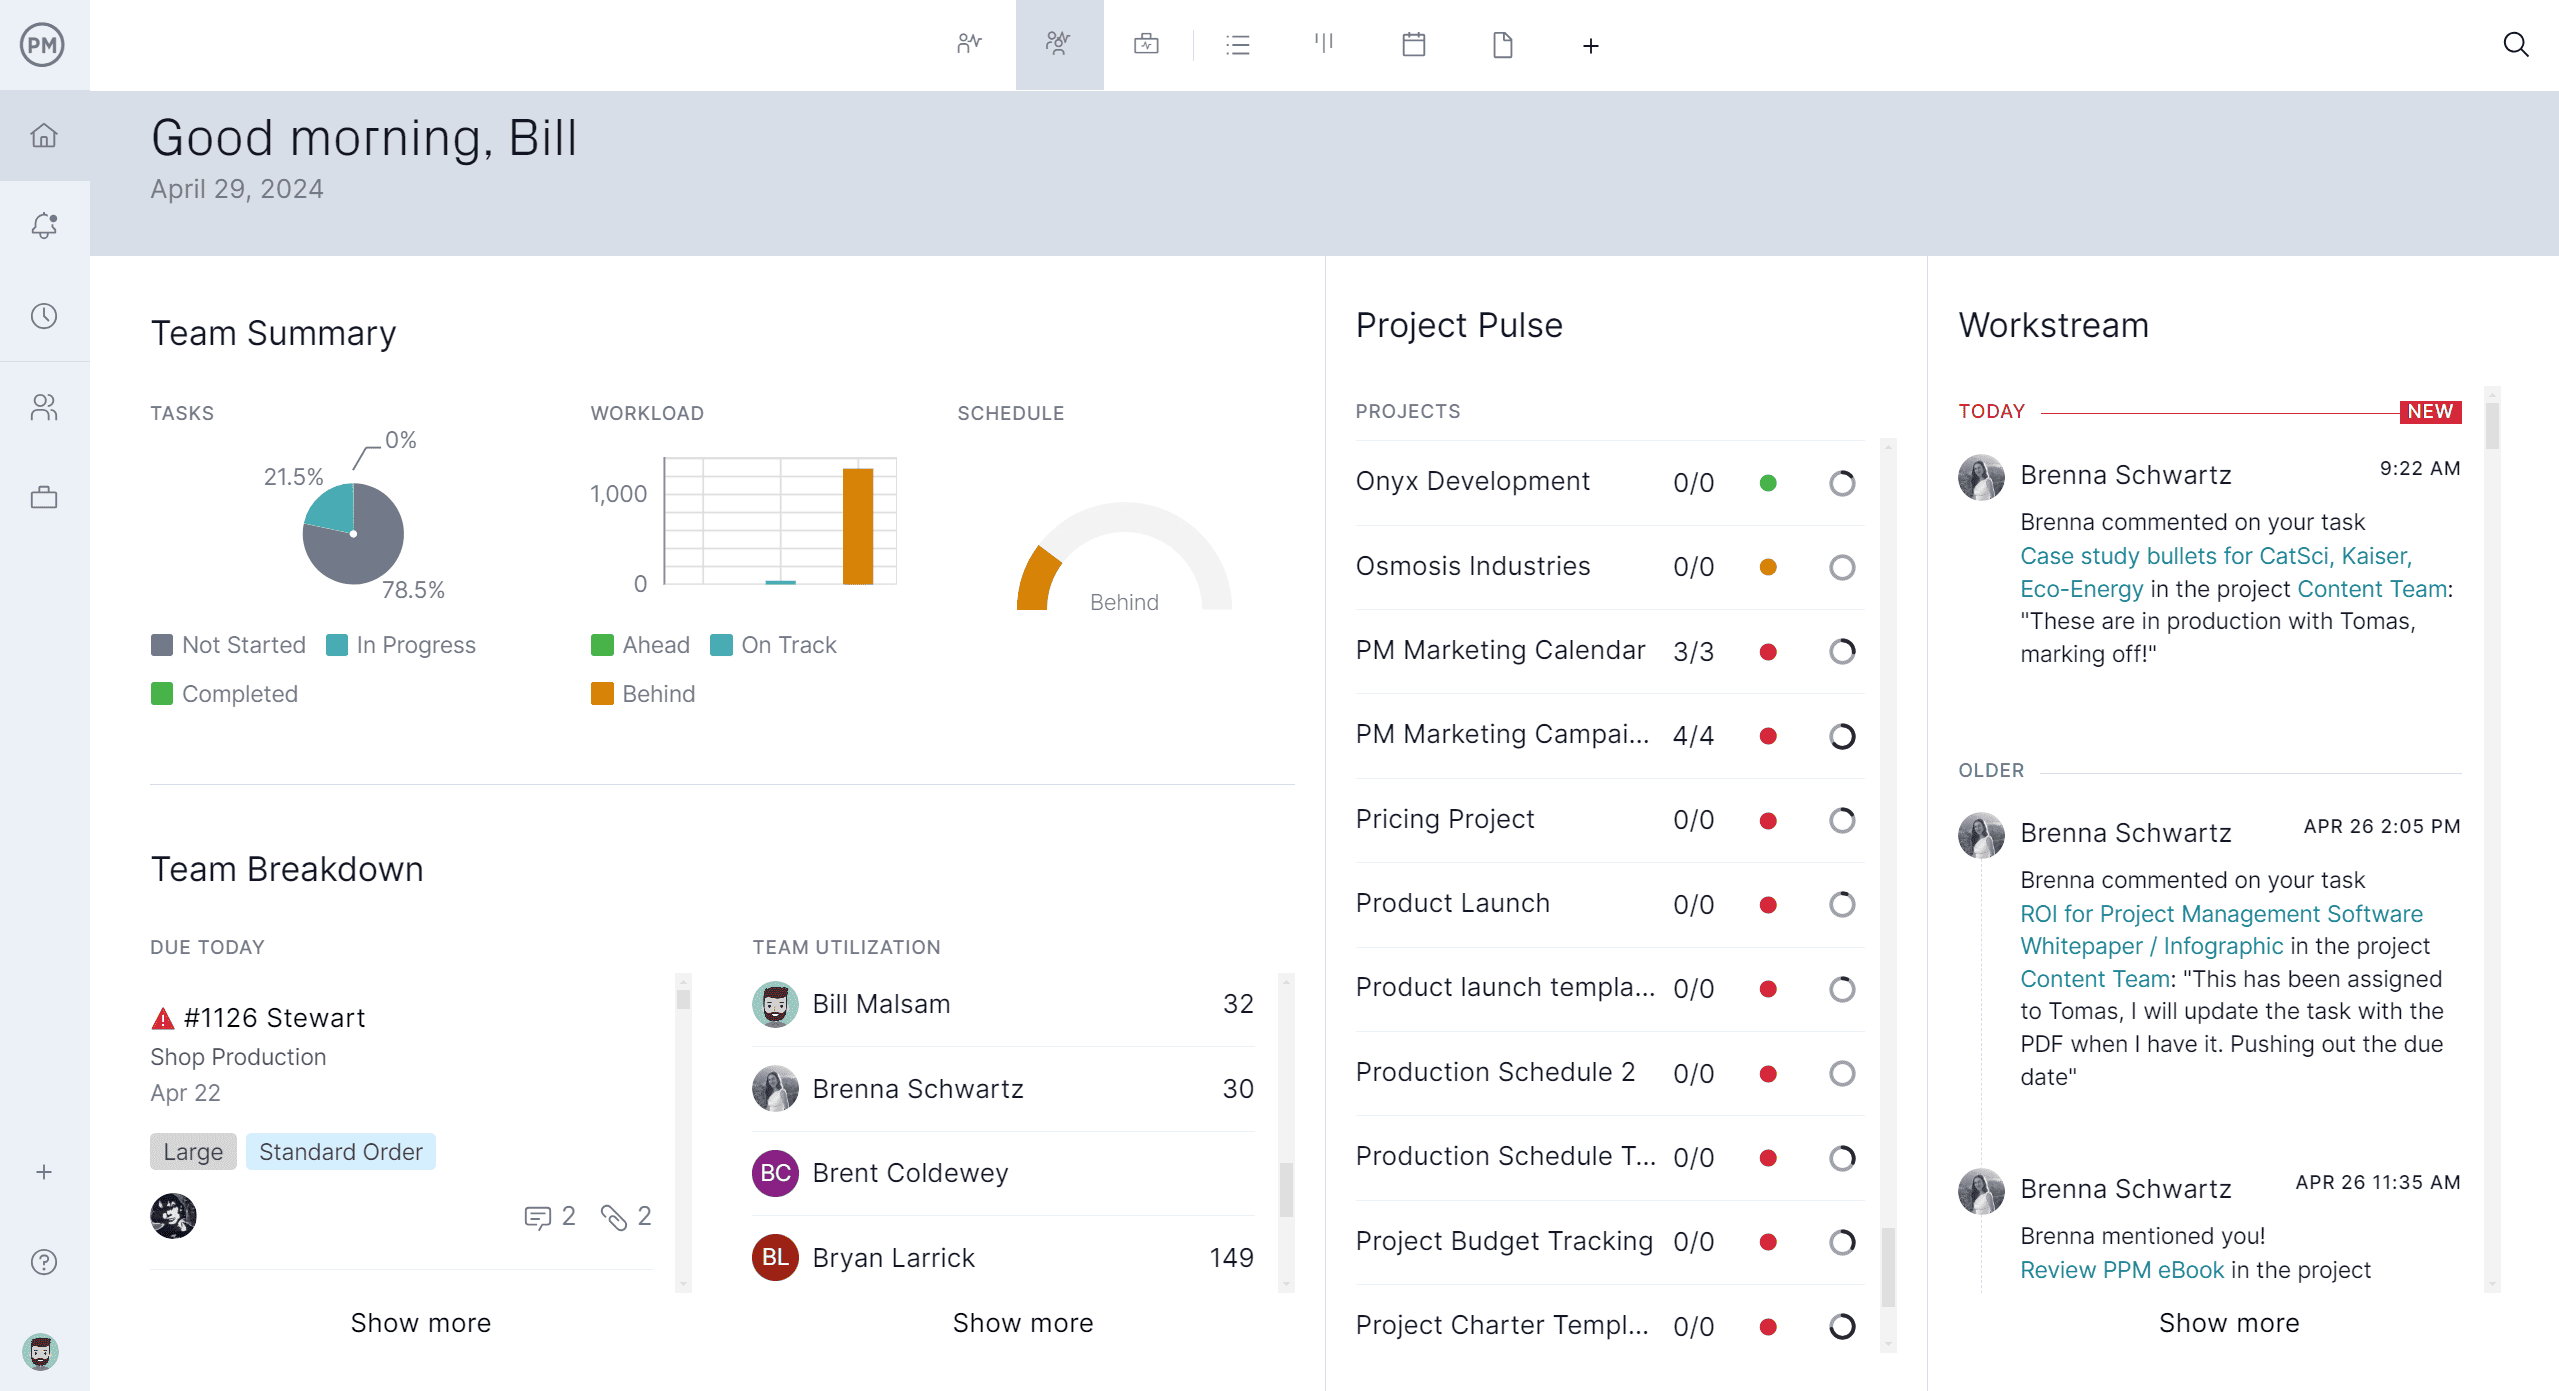
ProjectManager is award-winning project and portfolio management software with powerful Gantt charts that are the ideal platform for building and managing a CPM network diagram. They not only display tasks, durations and dependencies in a clear, interactive format, but also allow users to link all four types of task dependencies, filter for the critical path network, and set baselines to track variance in real time.
With drag-and-drop updates, color-coded progress bars and seamless integration with resource management and tracking tools, our software gives teams the precision and flexibility they need to manage any critical path network diagram with confidence. Get started with ProjectManager today for free.
When to Make a CPM Network Diagram
A CPM network diagram should be created during the early planning phase of a project—ideally after the work breakdown structure is defined and before scheduling begins. This timing ensures that all tasks, durations and dependencies are identified, allowing project managers to map out the logical sequence of work. Building a critical path network diagram at this stage helps highlight which tasks are time-sensitive and which have flexibility, setting a foundation for efficient scheduling and resource allocation.
You should also make a CPM network when managing complex projects with many interdependent activities or tight deadlines. It’s especially useful for construction, engineering, IT or any project where delays to one task could create costly ripple effects. A CMP network diagram helps prevent scheduling conflicts, manage risks and keep the entire project on track by visualizing the critical path network—the chain of tasks that directly determines the project’s completion date.
Get your free
Critical Path Template
Use this free Critical Path Template for Excel to manage your projects better.
How to Make a CPM Network Diagram
Here’s a structured guide on how to build a CPM network diagram, ideal for project teams looking to map tasks and visualize the critical path. A CPM network, or critical path network diagram, helps identify the sequence of tasks that directly affect a project’s finish date. The steps below walk you through the process of building one from start to finish.
1. Make a Project Task List and Estimate Duration of Tasks
Start by listing all the tasks required to complete your project. Break down the project into manageable activities and assign an estimated duration to each task. This lays the foundation for building the CPM network diagram and helps ensure no work is overlooked.

2. Identify Task Dependencies
Next, determine how tasks relate to one another. Dependencies define the order in which tasks must be performed. Knowing which tasks must precede others is critical to outlining the critical path network and avoiding scheduling conflicts later in the process.

There are four types of task dependencies used in a CMP network diagram, each defining different timing relationships between two activities. Understanding them helps you accurately structure the flow of work in your network.
- Finish to Start (FS): The most common type—Task B cannot begin until Task A is completed. For example, painting can’t start until the surface is cleaned.
- Start to Start (SS): Task B can’t begin until Task A begins. Both tasks can run in parallel once the first has started, such as digging and laying pipe.
- Finish to Finish (FF): Task B cannot finish until Task A finishes. Both tasks may run independently, but must complete around the same time, like simultaneous testing and documentation finalization.
- Start to Finish (SF): Task B cannot finish until Task A starts. This rare dependency occurs in situations like shift handovers, where the outgoing shift ends only after the incoming shift begins.
Follow these steps to create a detailed CPM network diagram that supports accurate scheduling, better resource allocation and more effective project management.
3. Establish Task Sequences
When making a CPM network diagram, establishing the task sequence involves organizing all project activities in the order they must be performed based on their dependencies. This step ensures that each task logically follows or runs parallel to others as needed, forming a clear workflow. By sequencing tasks accurately, you can identify the critical path network and ensure the project progresses smoothly without scheduling conflicts or delays.
4. Draw Nodes for Project Tasks and Link Them Together
To draw nodes for project tasks and link them together, start by representing each task as a box or circle—called a node—in your diagram. Then, use arrows to connect these nodes according to their dependencies, showing the flow and order in which tasks must be completed. This visual map helps outline the sequence of work and highlights the relationships between tasks in your CPM network diagram.

The task nodes must show the Early Start (ES), Early Finish (EF), Late Start (LS) and Late Finish (LF) for each task. Here’s a quick explanation of what each of these means in the process of creating a CPM diagram.
- Early Start (ES): The earliest time an activity can begin, assuming all its predecessors start as early as possible. It’s calculated during the forward pass.
- Early Finish (EF): The earliest time an activity can finish, calculated during the forward pass as: EF = ES + Duration
- Late Start (LS): The latest time an activity can start without delaying the project’s finish date. Calculated during the backward pass of the diagram.
- Late Finish (LF): The latest time an activity can finish without delaying the project’s finish date, calculated during the backward pass as: LF = LS + Duration
5. Perform the Forward Pass Calculations
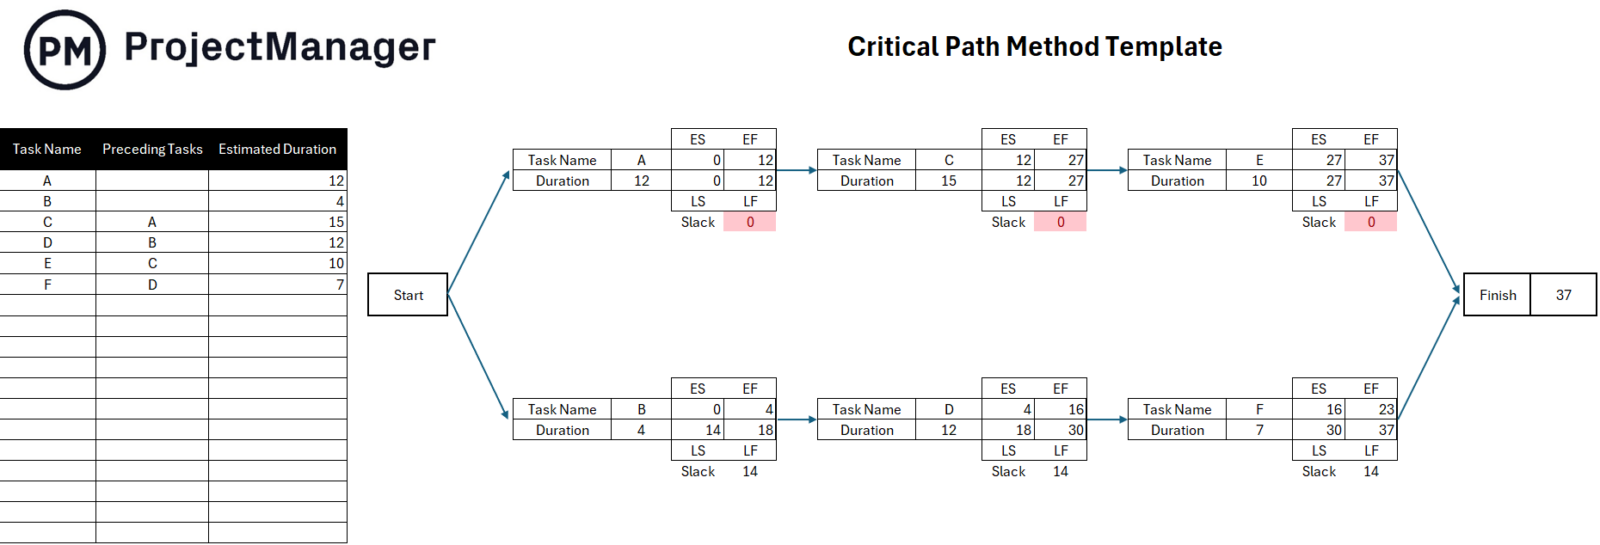
We’ll begin calculating the forward pass for the first two activities in the CPM network diagram: tasks A and B. Since neither has any predecessors, their early start (ES) is set to zero. For task A, the early finish (EF) is calculated as EF = 0 + 12, and for task B, EF = 0 + 4, as shown below.

Earlier, we noted that the method for determining ES and EF changes slightly starting with tasks C, D, E, and F, since their early start depends on the early finish of the task before them.
Specifically:
- Task C begins as soon as Task A finishes (EF = 12)
- Task D begins as soon as Task B finishes (EF = 4)
- Task E starts after Task C ends (EF = 27)
- Task F starts after Task D ends (EF = 16)
Once these ES values are established, you calculate each EF by simply adding the task’s duration. The highest EF, which defines the project’s length, comes from task E — totaling 37 days.

After determining the ES and EF for every task in the project, the next step is to perform the backward pass.
6. Perform the Backward Pass Calculations
To begin the backward pass, we assign an LF value to tasks E and F, which corresponds to the highest EF in the CPM network diagram — 37 (the EF of task E). Next, we determine the LS for tasks E and F by subtracting their duration from the LF of 37, using the formula LS = LF – t.
- Task E: LS = 37 – 10 = 27
- Task F: LS = 37 – 7 = 30
This marks the first step of the backward pass in the critical path method.

For tasks A, B, C, and D, their LF is set to the LS of their succeeding task. Their LS is then calculated with the same formula: LS = LF – t.
7. Identify the Critical Path of the Project
After the forward pass and backward pass calculations have been completed, all ES, EF, LS and LF values should be revealed. Then, the next step is to identify the critical path of the project by calculating the “slack” of each task by applying the formula: Slack = LF-EF.
The slack of a project task, also known as float, refers to the amount of time a task can be delayed without affecting the project’s overall completion time. It shows scheduling flexibility for non-critical tasks. Tasks on the critical path have zero slack, while others may have positive slack, allowing some delay without impacting project deadlines.
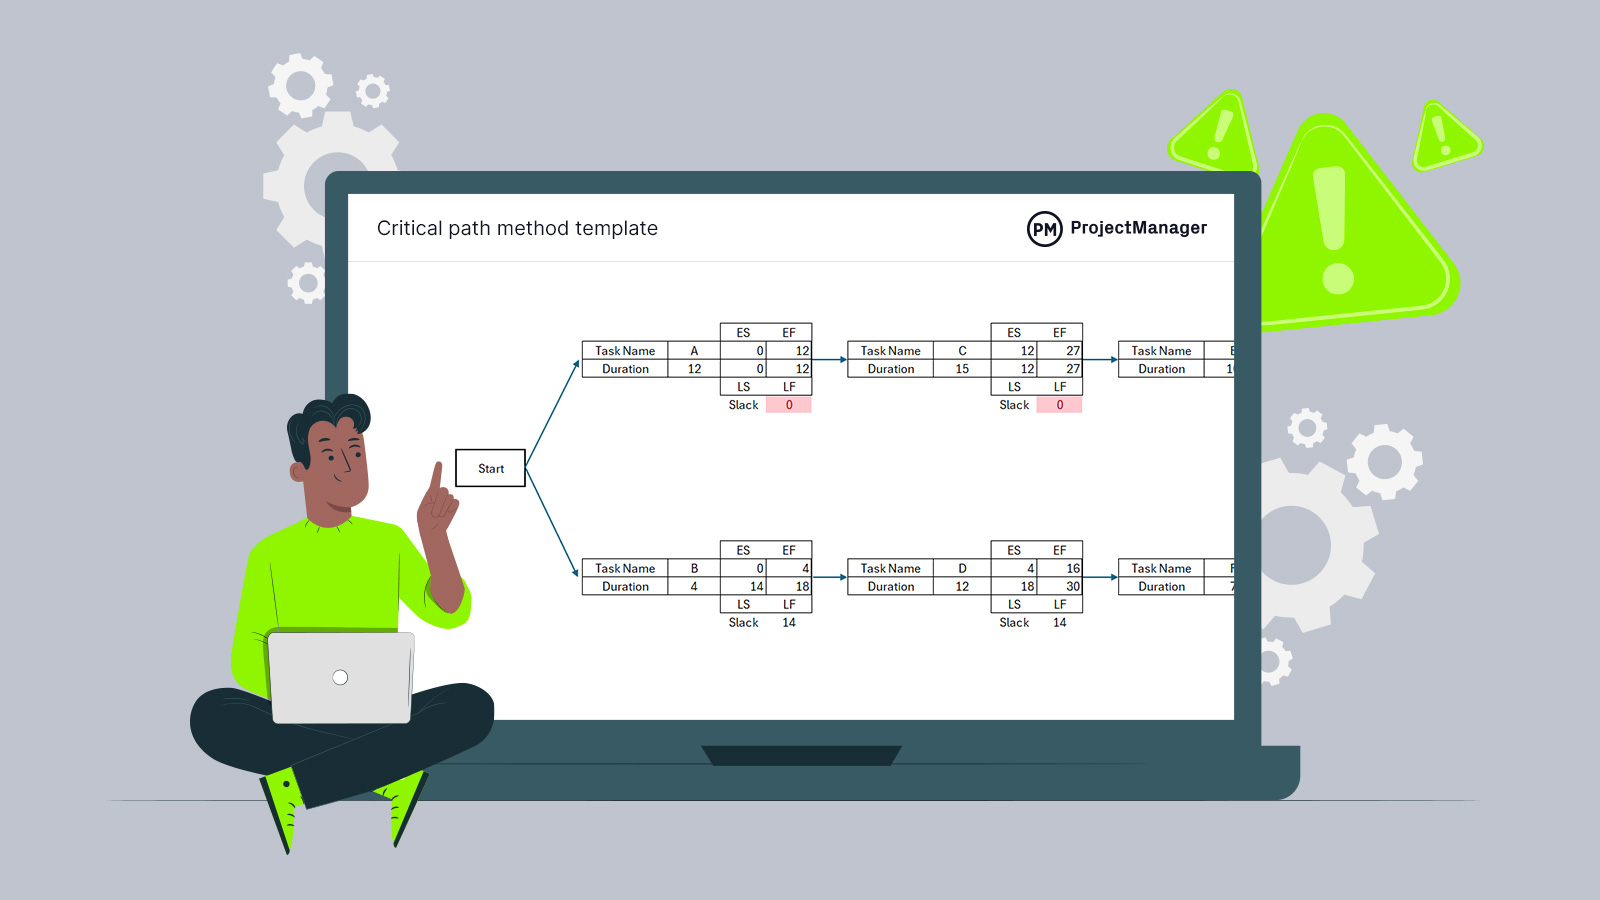
Congratulations! After following these steps, the critical path network diagram is complete, as the image shows below.

CPM Network Diagram Template
Download a free CPM network diagram template to quickly create a visual representation of a project’s tasks and their dependencies. By using this template, teams can efficiently map out the sequence of activities, estimate durations and identify the critical path network—the longest chain of dependent tasks that determines the project’s minimum completion time. The template simplifies the process of building a CMP network diagram by providing a consistent structure for organizing nodes and connecting them based on task relationships.
While using project management software is preferable as it ensures accuracy and saves time, those who aren’t ready to upgrade will find this free template a decent workaround. It makes it easier to spot scheduling conflicts, allocate resources effectively and manage risks. Whether for construction, IT or any complex project, a CPM network template is a valuable tool to help teams visualize and control project timelines with confidence.
Benefits of a CPM Network Diagram for Project Scheduling
Using a CPM network diagram for project scheduling offers numerous benefits that enhance planning accuracy and overall project control. By visually mapping out tasks, their durations and dependencies, teams gain critical insights that improve decision-making, resource allocation and timeline management. The following sections explain key advantages of incorporating a CPM network into your scheduling process.
Clear Prioritization of Tasks for Resource Allocation
A CPM network diagram highlights the critical path—the sequence of tasks that directly impacts the project’s completion date. This clarity allows project managers to prioritize resources on high-impact activities, ensuring that critical tasks receive the attention needed to prevent delays and keep the project on track.
Realistic Estimation of Project Timelines
By calculating the earliest and latest start and finish times for each task, a CPM network provides a realistic picture of the project schedule. This helps avoid overly optimistic deadlines and enables teams to anticipate potential bottlenecks, improving overall timeline accuracy and reliability.
Facilitates Task Sequencing and Dependency Mapping
The CPM network diagram visually organizes all project activities and their dependencies, making it easier to understand task sequences and how delays might ripple through the project. This visualization supports better planning, risk management and communication across stakeholders.
CPM Network Diagram Explained by a PMP
To learn more about a CPM network diagram, watch this video featuring Jennifer Bridges, PMP. It covers how to construct and monitor a critical path within your project schedule, showing practical techniques for tracking tasks that determine your project’s completion date.
She emphasizes routine monitoring of the critical path—advising project managers to review it regularly to catch potential delays before they affect overall delivery. By mapping dependencies and focusing attention on critical tasks, the recommended approach supports proactive schedule control and helps ensure project deadlines are met consistently.
Why ProjectManager Is Better Than a CPM Network Diagram
ProjectManager is a more powerful and flexible solution than a static CPM network diagram because it goes beyond planning to support full project execution and real-time collaboration. While a CPM network diagram visualizes task sequences and highlights the critical path, it typically exists as a static tool—often built in spreadsheets or drawing tools—without live updates or integration with other workflows.
In contrast, our multiple project views, including Gantt charts, kanban boards, calendars, task lists and sheet views, let teams choose how they visualize and manage their work while automatically reflecting changes across all views. This flexibility supports different working styles and keeps all stakeholders aligned with the most current project data.
Assign Teams, Balance Workloads and More
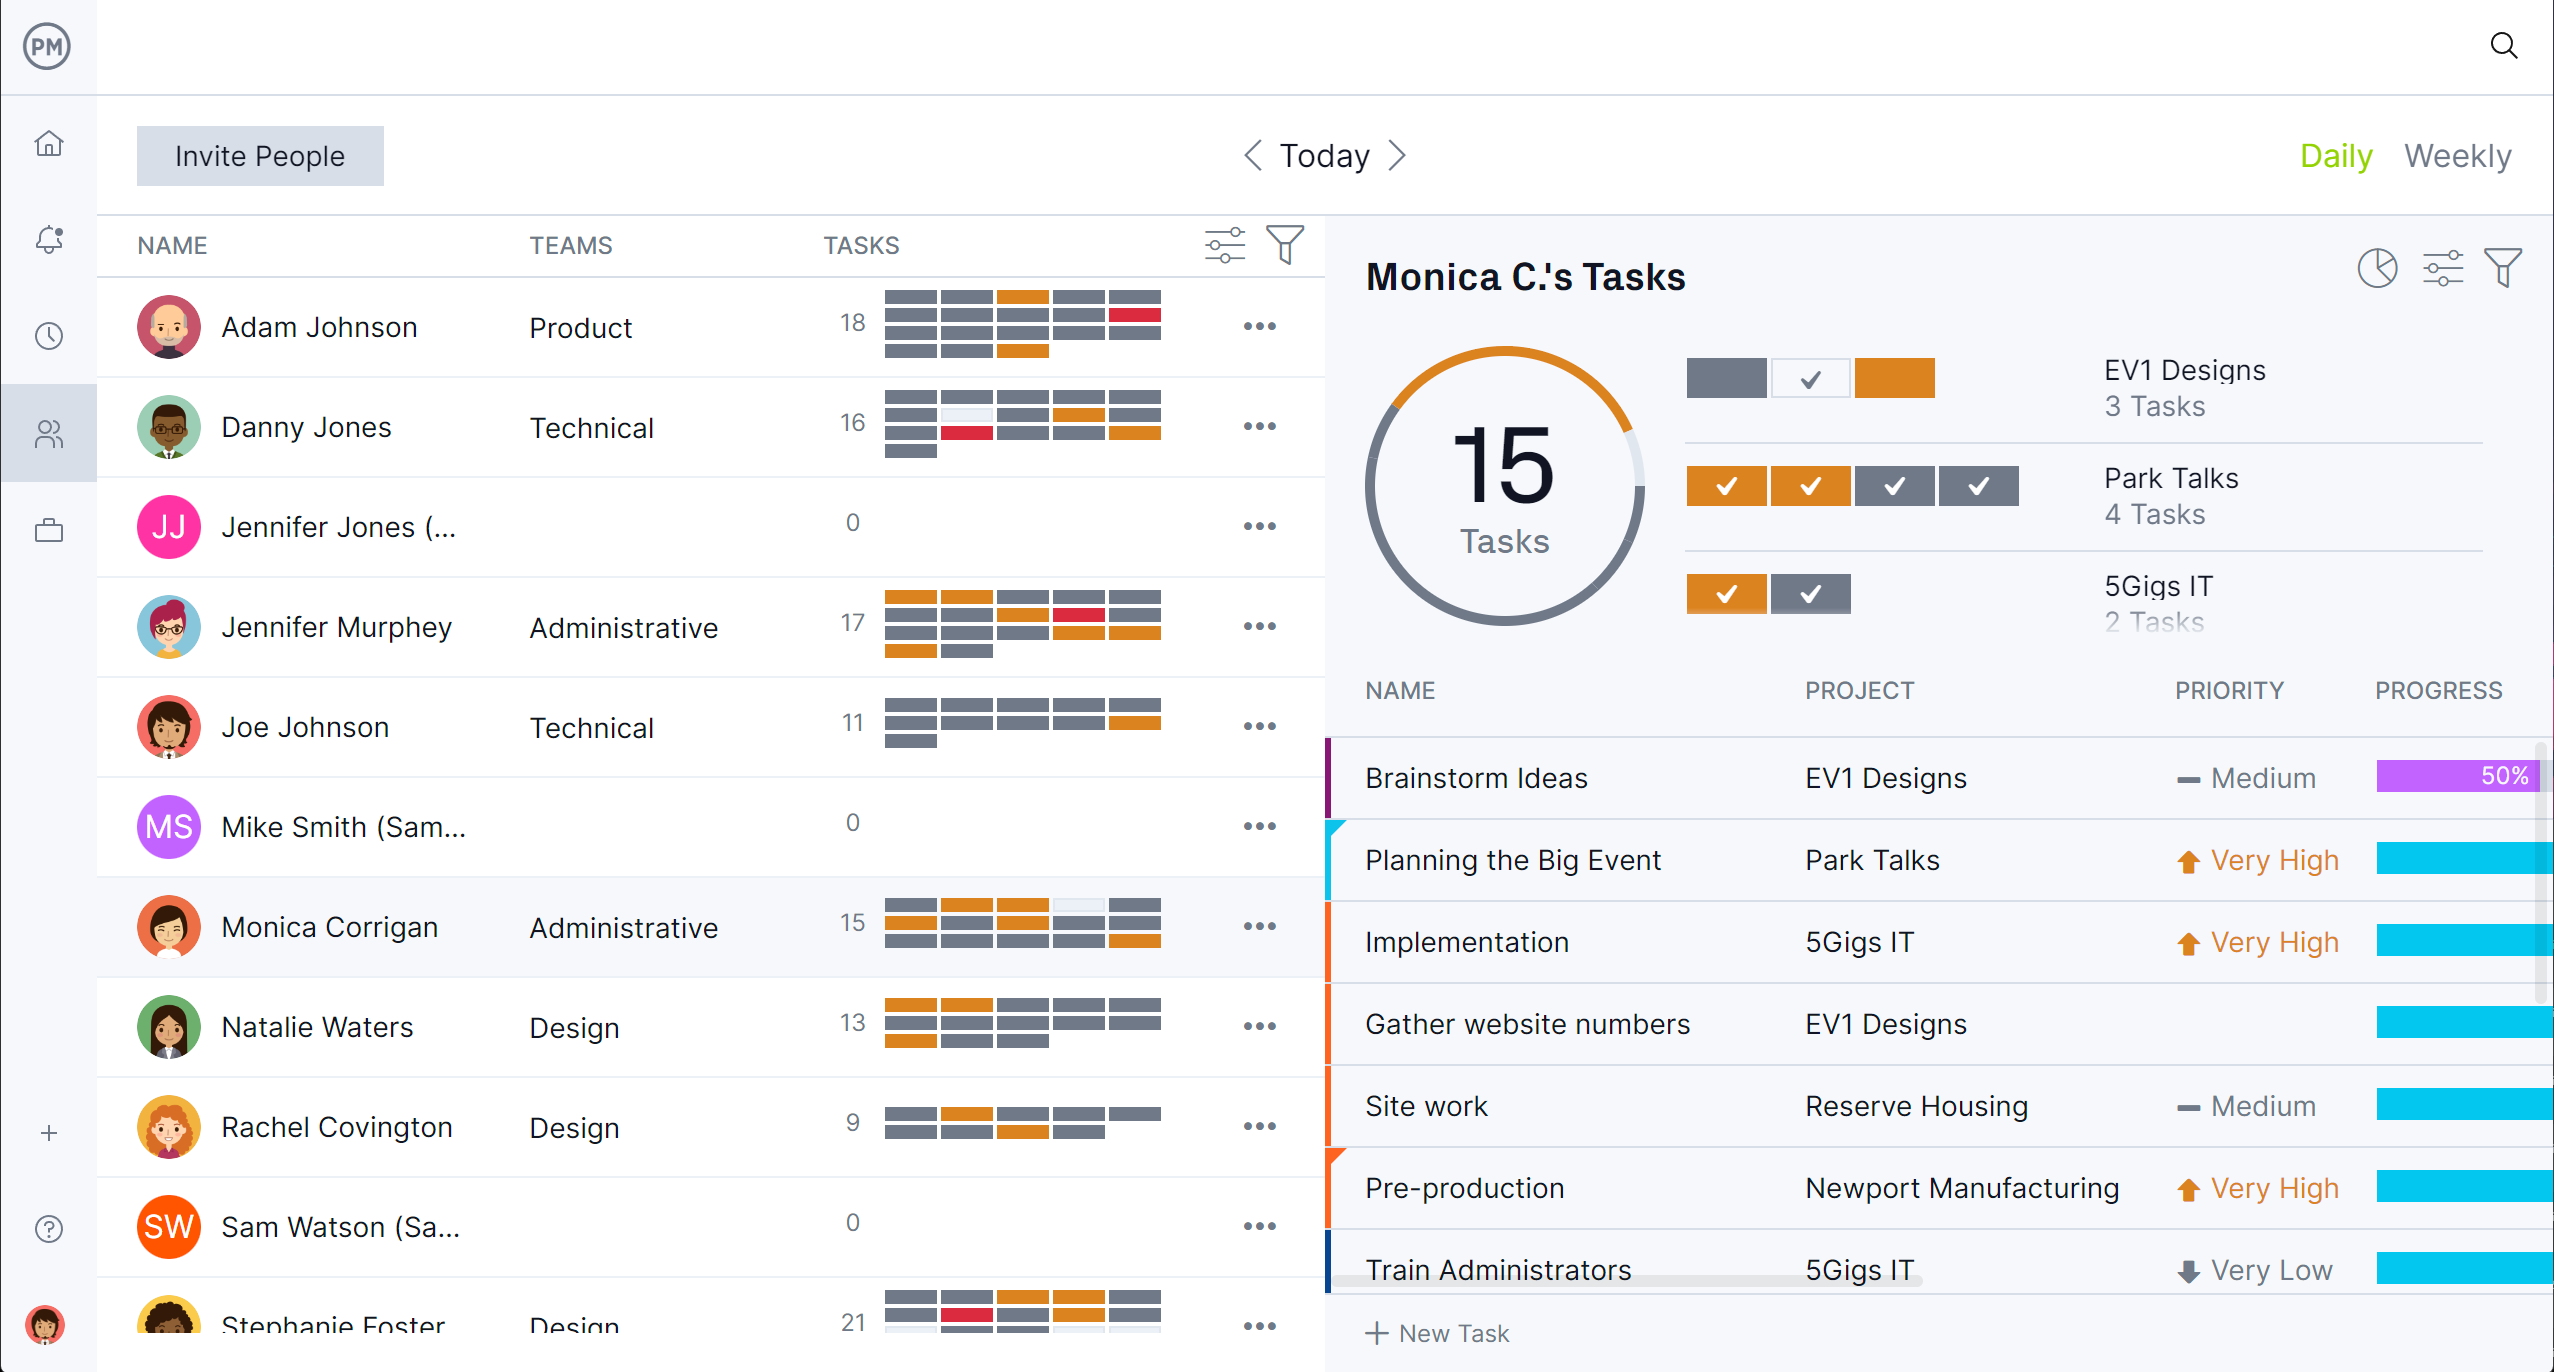
Our resource management is another major advantage over a traditional critical path network diagram. Instead of simply showing task order and duration, ProjectManager allows users to assign team members to tasks based on availability, balance workloads using color-coded charts and monitor capacity on the team page.
This ensures that resources are not only allocated to critical path activities but also optimized across the entire project, reducing the risk of delays due to overallocation or miscommunication. It brings actionable insight into the project’s execution, not just its structure. The team page provides a daily or weekly overview of activity, which can be filtered by priority or progress, and tasks are updated without leaving the page.
Track and Quickly Adapt in Real Time
A CPM network diagram can’t track and adapt to change, but our software can. With real-time project and portfolio dashboards, secure timesheets and customizable reports, teams can monitor progress, spot issues early and respond immediately.
Built-in baseline comparison features allow project managers to track planned vs. actual performance, which is crucial for managing the critical path network as the project evolves. These tools make our software a dynamic, execution-ready platform that brings the logic of the CPM network to life—keeping projects on time, on budget and moving forward.
Related CPM Diagram Content
The CPM network diagram is a useful planning tool in project management. For those curious to learn more, follow the links below. They lead to recent articles on critical path software, how it applies to industries like construction and more.
ProjectManager is online project and portfolio management software that connects teams whether they’re in the office or out in the field. They can share files, comment at the task level and stay updated with email and in-app notifications. Join teams at Avis, Nestle and Siemens who are using our software to deliver successful projects. Get started with ProjectManager today for free.


