


If you’re working in project management, then you know about Monday.com. You’re probably getting a ton of online ads. The company has invested a ton of money in its marketing to people working on projects. But is there a Monday Gantt chart?
Let’s take a look at this popular project management software and see if it delivers on one of the most essential project management tools. We’ll avoid the question as to why Monday.com named itself after the most hated day of the week and leave that for another time.
What Is Monday.com?
Monday.com bills itself as a work management tool. It says its purpose is to help teams and their organizations work more efficiently. It does this with features that track projects and create workflows, adding automation and visual data. But it’s mostly a collaborative tool.
This highly customizable tool is understandably popular as it has a forever-free plan. Its modern look appeals to a wide range of consumers, and there are tons of templates to create boards and automation. It integrates with a lot of other apps. Plus, there are bells and whistles that the general public will enjoy, such as animated fireworks when you complete a task, though this isn’t likely to sway project management professionals.
But what about that all-important project management tool, the Gantt chart? It’s not unusual that the free plan is limited to two users and doesn’t have a full suite of features. Less unusual is the confusing pricing plans. But for our discussion, it all boils down to one question.
Does Monday.com Have a Gantt Chart?
Why is the question of a Monday.com Gantt chart so critical? That’s because Gantt charts are the go-to tool for scheduling and planning a project. True, agile teams aren’t going to be interested in Gantt charts, but the upper management who oversees them will likely be working on Gantt charts.
Yes, Gantt charts are best for traditional, waterfall methodology, but with cross-functional teams, you need a full array of project tools at your disposal, not just task lists or kanban boards, as important as those tools are. Gantt charts are like spreadsheets with the right side populated with a timeline showing the entire project.
Related: Best Gantt Chart Software Rankings
More than just a visual tool, they can link dependencies to avoid costly delays, set milestones to help with project tracking, organize tasks, resources, costs and much more. They break projects into phases to make them more manageable. Few project managers would want to run a project without one. So is there a Monday.com Gantt chart?
Short Answer: Yes, Monday.com Has Gantt Charts
There is a Monday.com Gantt chart. It can be used to track project plans, monitor your progress and measure against your objectives at a basic level. Monday.com Gantt charts are good to manage any business or personal work. That’s true, in the most rudimentary way.
Long Answer: Monday.com Gantt Charts Lack Key Features for Project Management
Monday.com’s Gantt chart meets the minimum requirements to make a project timeline, but it can’t really be considered a Gantt chart tool that project managers can use to plan, schedule and monitor their projects.
If you’re looking for a powerful Gantt chart that can help plan, manage and track projects in real time, you’re looking for ProjectManager. Our award-winning project management software has robust Gantt charts that do everything Monday Gantt charts do and so much more. It’s easy to drag and drop all four types of task dependencies, you can filter for the critical path and set a baseline to track project variance in real time. That data is shared across the app, such as in real-time dashboards, timesheets, workload charts and much more. Get started with ProjectManager today for free.
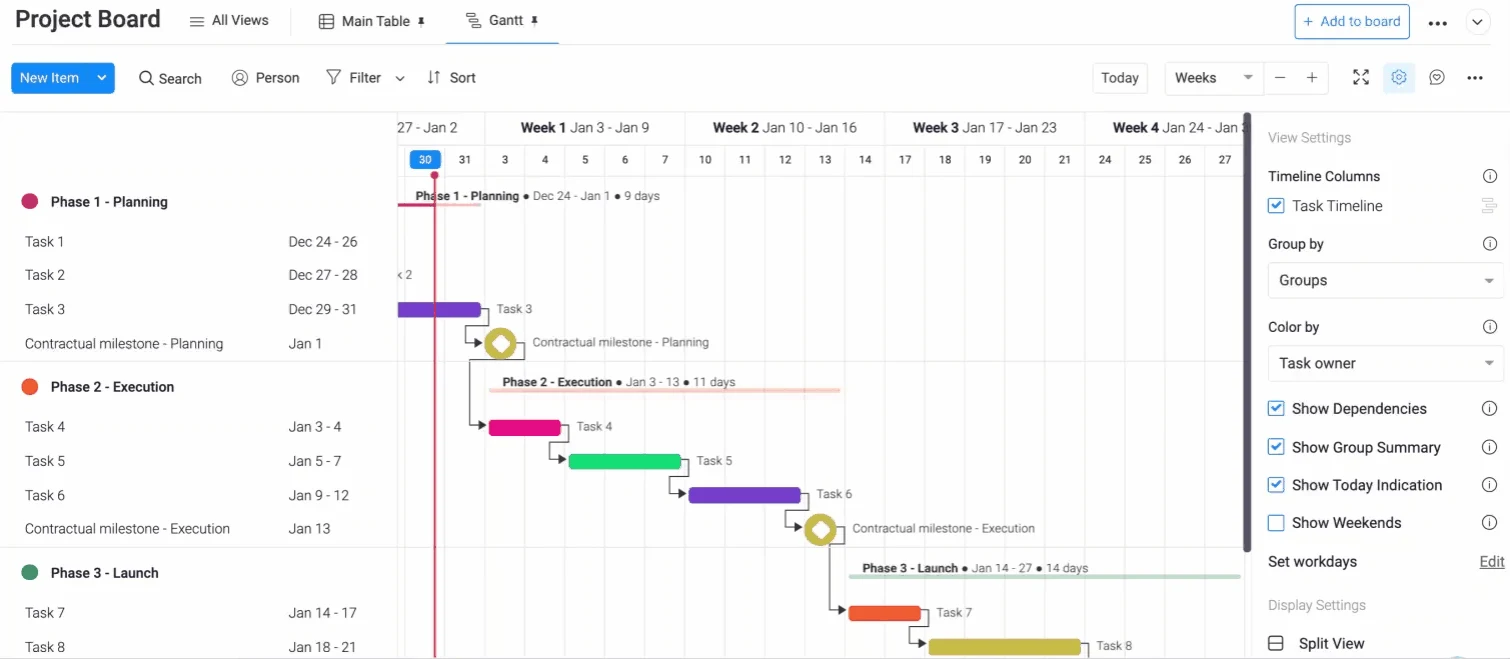
Monday.com Gantt Chart Features
The monday.com Gantt chart offers an intuitive visual timeline for planning and tracking projects. Teams can easily adjust task durations, set dependencies and visualize progress using customizable colors and layouts. With real-time collaboration, drag-and-drop scheduling and baseline comparisons, it helps users manage timelines and keep all stakeholders aligned on project milestones.
- Drag-and-drop task bars to adjust schedule.
- Create and manage task dependencies and milestones.
- Critical path calculation and visualization.
- Baseline snapshot feature to compare actual vs planned schedule.
- Customize time-scale view (days, weeks, months, quarters).
- Import tasks from Excel to board and convert into Gantt view.
- 100% customizable visuals: colors, labels, layout.
- Real-time updates and collaboration across teams.
- Integrations with other tools and workflows/automation support.
- View subtasks/items within Gantt view.
- Setting different groups for tasks/tasks phases and grouping in Gantt view.
What Project Management Features Is Monday.com Gantt Chart Missing?
While monday.com’s Gantt chart is sleek and user-friendly, it lacks several core project management capabilities. It doesn’t include resource allocation, cost tracking or workload balancing tools. Features like earned value analysis, cross-project dependencies and forecasting are missing, limiting its use for advanced performance analysis or comprehensive schedule and cost management.
- Monday.com’s Gantt chart does not allow users to allocate resources directly to project tasks.
- It does not provide workload balancing or resource capacity views.
- Estimated vs. actual cost tracking for tasks is not supported within the Gantt chart.
- Baseline creation and variance tracking are limited to schedule only—no cost or performance baselines.
- It does not offer a percent-complete column for tracking task progress numerically within the chart.
- Task prioritization indicators (e.g., high, medium, low) are not displayed in the Gantt view.
- Only one type of task dependency (finish-to-start) with no lead/lag time configuration.
- Cross-project dependencies are not supported.
- Risk management indicators (probability, impact, mitigation) are not visualized in the Gantt.
- Automatic recalculation of schedules after dependency or duration changes is limited.
How To Make a Monday.com Gantt Chart Better With ProjectManager
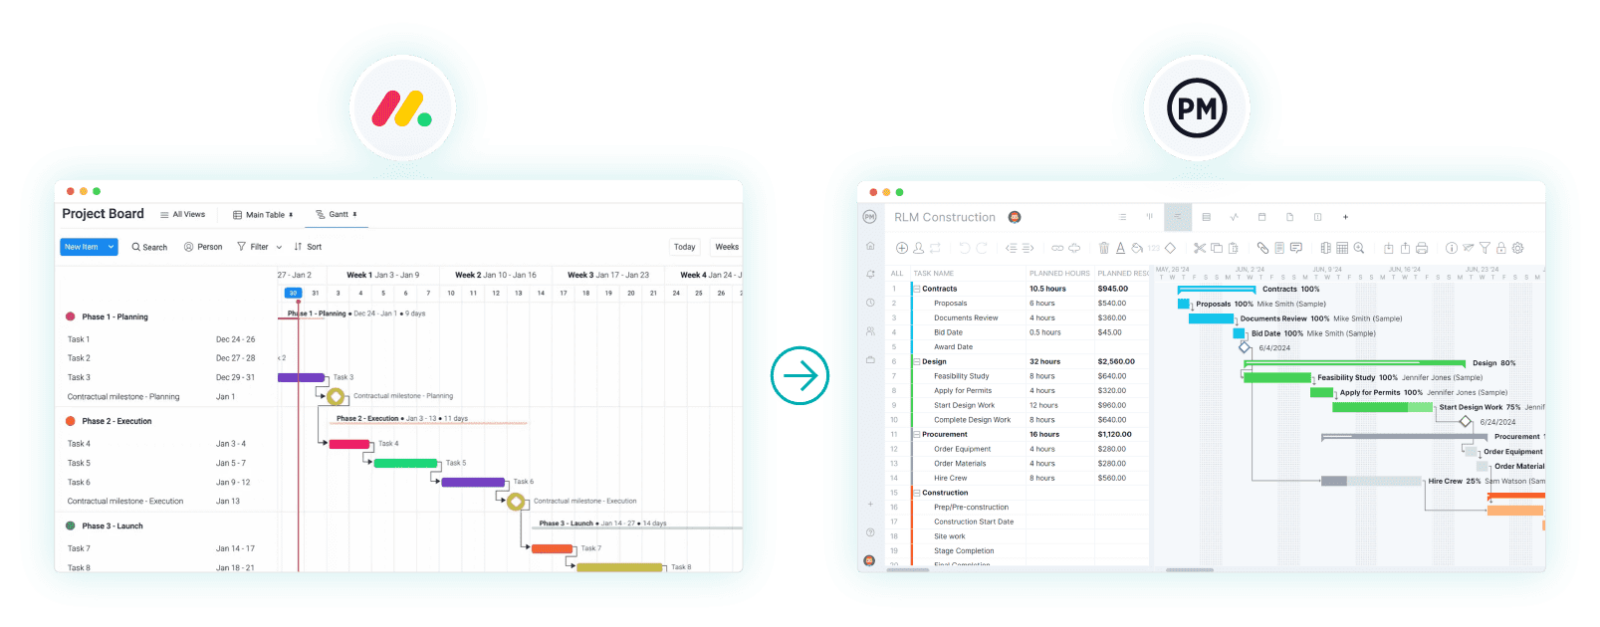
If you’re stuck using Monday.com but want to experience the full range of what a Gantt chart can do, there’s a workaround that can free you from the constraints of a Monday.com Gantt chart. ProjectManager makes it easy to take your project from Monday.com and import it into our software, freeing you to use a Gantt chart the way it should be used.
To get started, visit ProjectManager and take our free 30-day trial. There’s no credit card needed. It’s completely free and you’ll get access not only to our free Gantt chart software, but also task management, risk management and resource management features, plus multiple project planning views, real-time dashboards, timesheets and many more valuable project management tools. But before we dive into the process, let’s compare Monday.com’s Gantt chart and ProjectManager’s Gantt chart.
| monday.com Gantt Chart | ProjectManager Gantt Chart |
| Drag-and-drop task bars to adjust schedule ✅ | Drag-and-drop scheduling with automated dependency updates ✅ |
| Only one type of task dependency available❌ | Four types of task dependencies (FS, SS, FF, SF) ✅ |
| Critical path calculation and visualization ✅ | Critical path analysis built-in with real-time visualisation ✅ |
| Milestones support ✅ | Milestones, subtasks, and percent-complete tracking ✅ |
| Baseline snapshot feature to compare actual vs planned schedule ✅ | Baseline vs actual schedule and cost tracking ✅ |
| Customize time-scale view (days, weeks, months, quarters) ✅ | Time-scaled view with duration, start/end dates, and schedule variance ✅ |
| Import tasks from Excel to board and convert into Gantt view ✅ | Import MS Project, CSV, Excel and convert to live Gantt ✅ |
| 100% customizable visuals: colors, labels, layout ✅ | Custom colours, labels, layouts plus advanced visual filters ✅ |
| Real-time updates and collaboration across team ✅ | Real-time team collaboration + schedule, cost and resource integration ✅ |
| Integrations with other tools and workflows/automation support ✅ | Wide integrations + built-in reporting, resource & cost modules ✅ |
| View subtasks/items within Gantt view ✅ | Tasks, subtasks, WBS hierarchy supported ✅ |
| Grouping by task phases and setting groups in Gantt view ✅ | Supports WBS, phases, grouping and multi-project rollups ✅ |
| Filter and drill down into items within Gantt ✅ | Interactive filters, drill-down, analytical dashboards included ✅ |
| Does not allow resource allocation, workload balancing ❌ | Built-in resource allocation and workload tracking ✅ |
| Does not support estimated vs actual task cost tracking ❌ | Allows cost estimation, actuals, variance tracking ✅ |
| No cost baseline feature for monitoring cost variance ❌ | Schedule and cost baselines & variances supported ✅ |
| No multi-board/cross-project dependencies without workarounds ❌ | Cross-project dependencies and portfolio Gantt views supported ✅ |
| No what-if scenario modelling or simulation ❌ | What-if modelling and schedule simulations available ✅ |
| Progress tracking visual only, no built-in percent-complete or trend metrics ❌ | Percent-complete, variance trends and analytics built into Gantt ✅ |
Export & Import Your Monday.com Projects
Pick the project from Monday.com that you want to export. Save it as a CSV or Excel file. Now it’s ready to be imported into ProjectManager.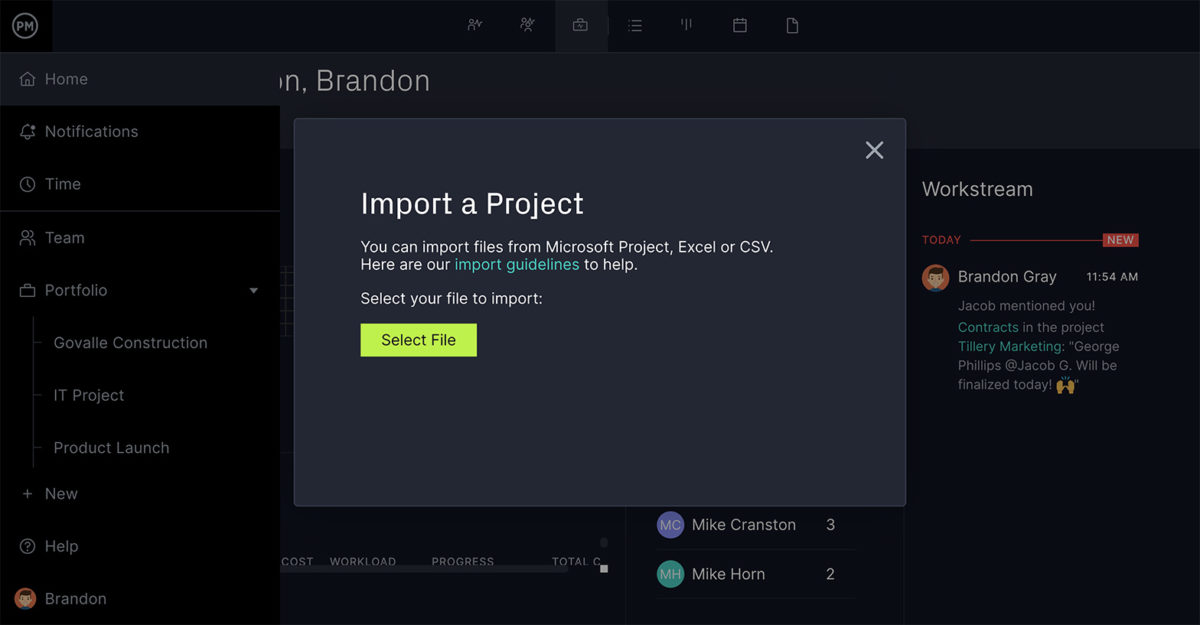
Choose the Excel File
Log into ProjectManager and toggle to the Gantt chart where you’ll see an import button. Click it and a window will pop up that says “Import a Project.” Click “Select File” and find your Monday.com project and select it.
Select Options
Now that your Monday.com file is uploaded to ProjectManager, you’ll want to decide if this is going to be a new project or if you’d prefer to add it to an existing project. If you’re adding to an existing project, be sure to note whether to keep the existing data or delete it.
Import What Data?
The last step is to either import all the data from your Monday.com file or only the task list. Select the one you want to import and click next.
Create a Gantt Chart!
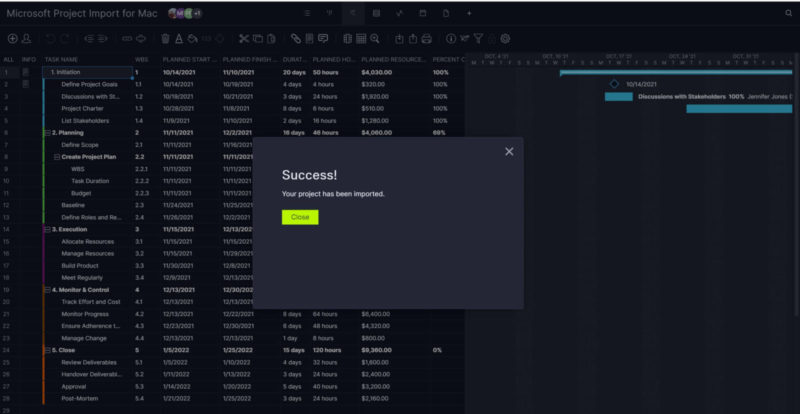
When you see the “Success!” window, that means you’re done. The Monday.com file has been imported and you’re ready to use a real Gantt chart in ProjectManager. Now you’ll see what a real Gantt chart can do. It’s packed with features and connects to the rest of your project management software.
Monday.com Gantt Chart Pricing
The Gantt chart view in Monday.com is available starting from the Standard plan. It’s not included in the Free or Basic plans, which can be limiting for smaller teams or individuals managing simple projects. Paid tiers unlock timeline and Gantt functionality along with more advanced features.
- Free Plan: Monday.com Gantt chart is not included in this pricing plan.
- Basic Plan ($9/user/month, billed annually): Monday.com Gantt chart is not included in this pricing plan, which only offers basic dashboards and views.
- Standard Plan ($12/user/month, billed annually): Monday.com Gantt chart is included in this plan with timeline and dependency features for task scheduling.
- Pro Plan ($19/user/month, billed annually): Monday.com Gantt chart is included in this plan with additional capabilities such as formulas, and time tracking.
- Enterprise Plan (custom pricing): Monday.com Gantt chart is included in this plan with some portfolio management, resource management, and reporting features.
What Can You Use a Monday.com Gantt Chart For?
The monday.com Gantt chart is primarily designed to help teams visualize their project timelines. It provides a clear, interactive way to map out tasks, deadlines and dependencies, making it useful for presenting schedules and ensuring everyone understands the project’s flow. However, its role ends there.
The monday.com Gantt chart functions mainly as a visual planning aid rather than a true project management tool. It lacks the advanced capabilities needed for complete project control, such as resource allocation, workload balancing, cost tracking and progress analysis.
Users can see when tasks are due, but not how delays or cost overruns affect the overall plan. There’s also no built-in functionality for forecasting, performance measurement or detailed reporting. While it’s helpful for creating attractive, easy-to-read timelines, monday.com’s Gantt chart falls short of what project managers need to fully plan, schedule and monitor a project’s performance from start to finish.
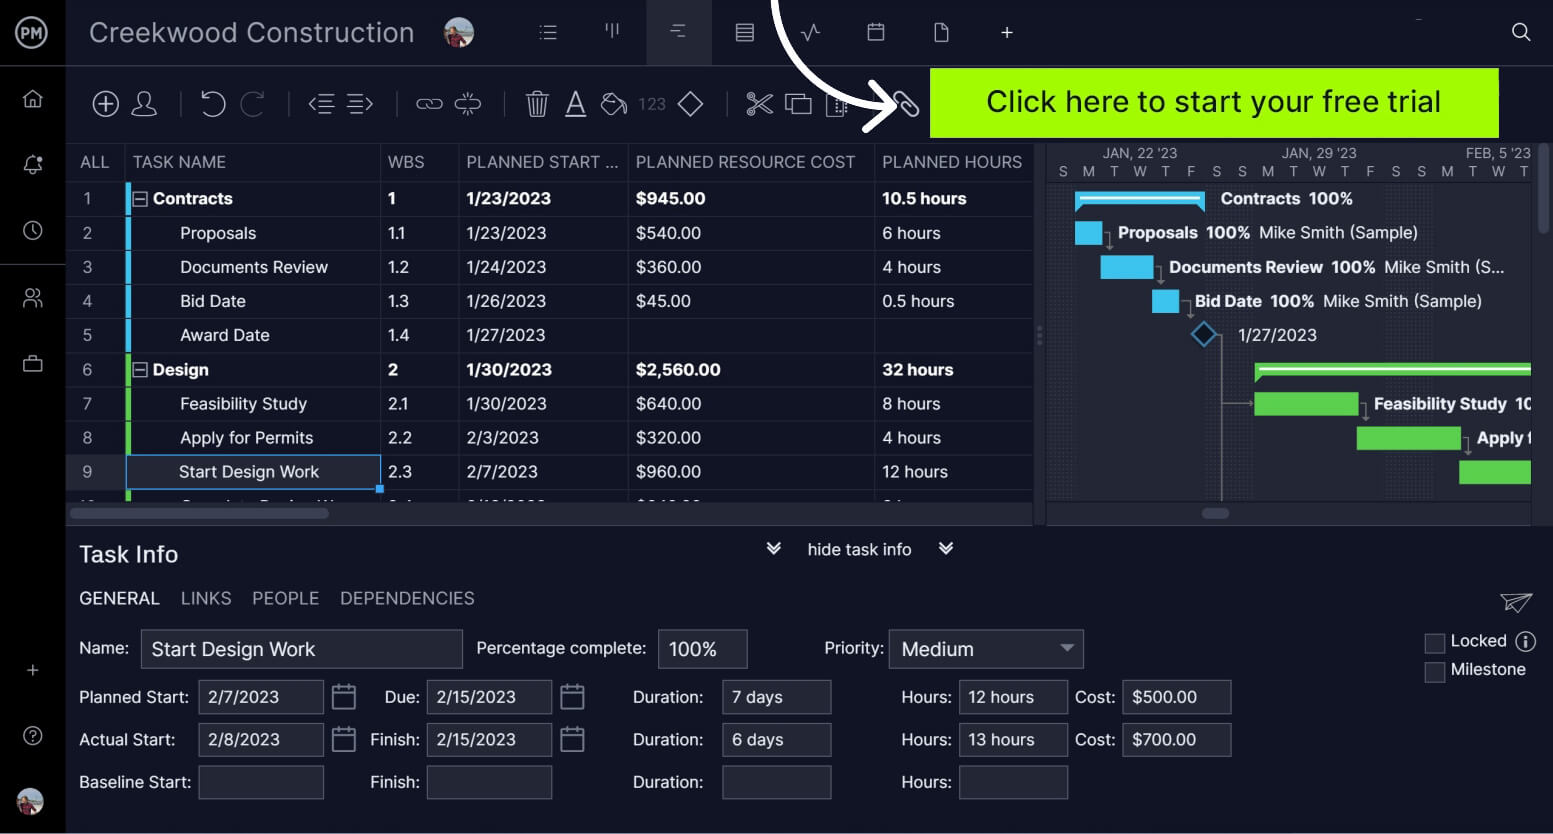
How to Use Your Monday.com Gantt Chart in ProjectManager
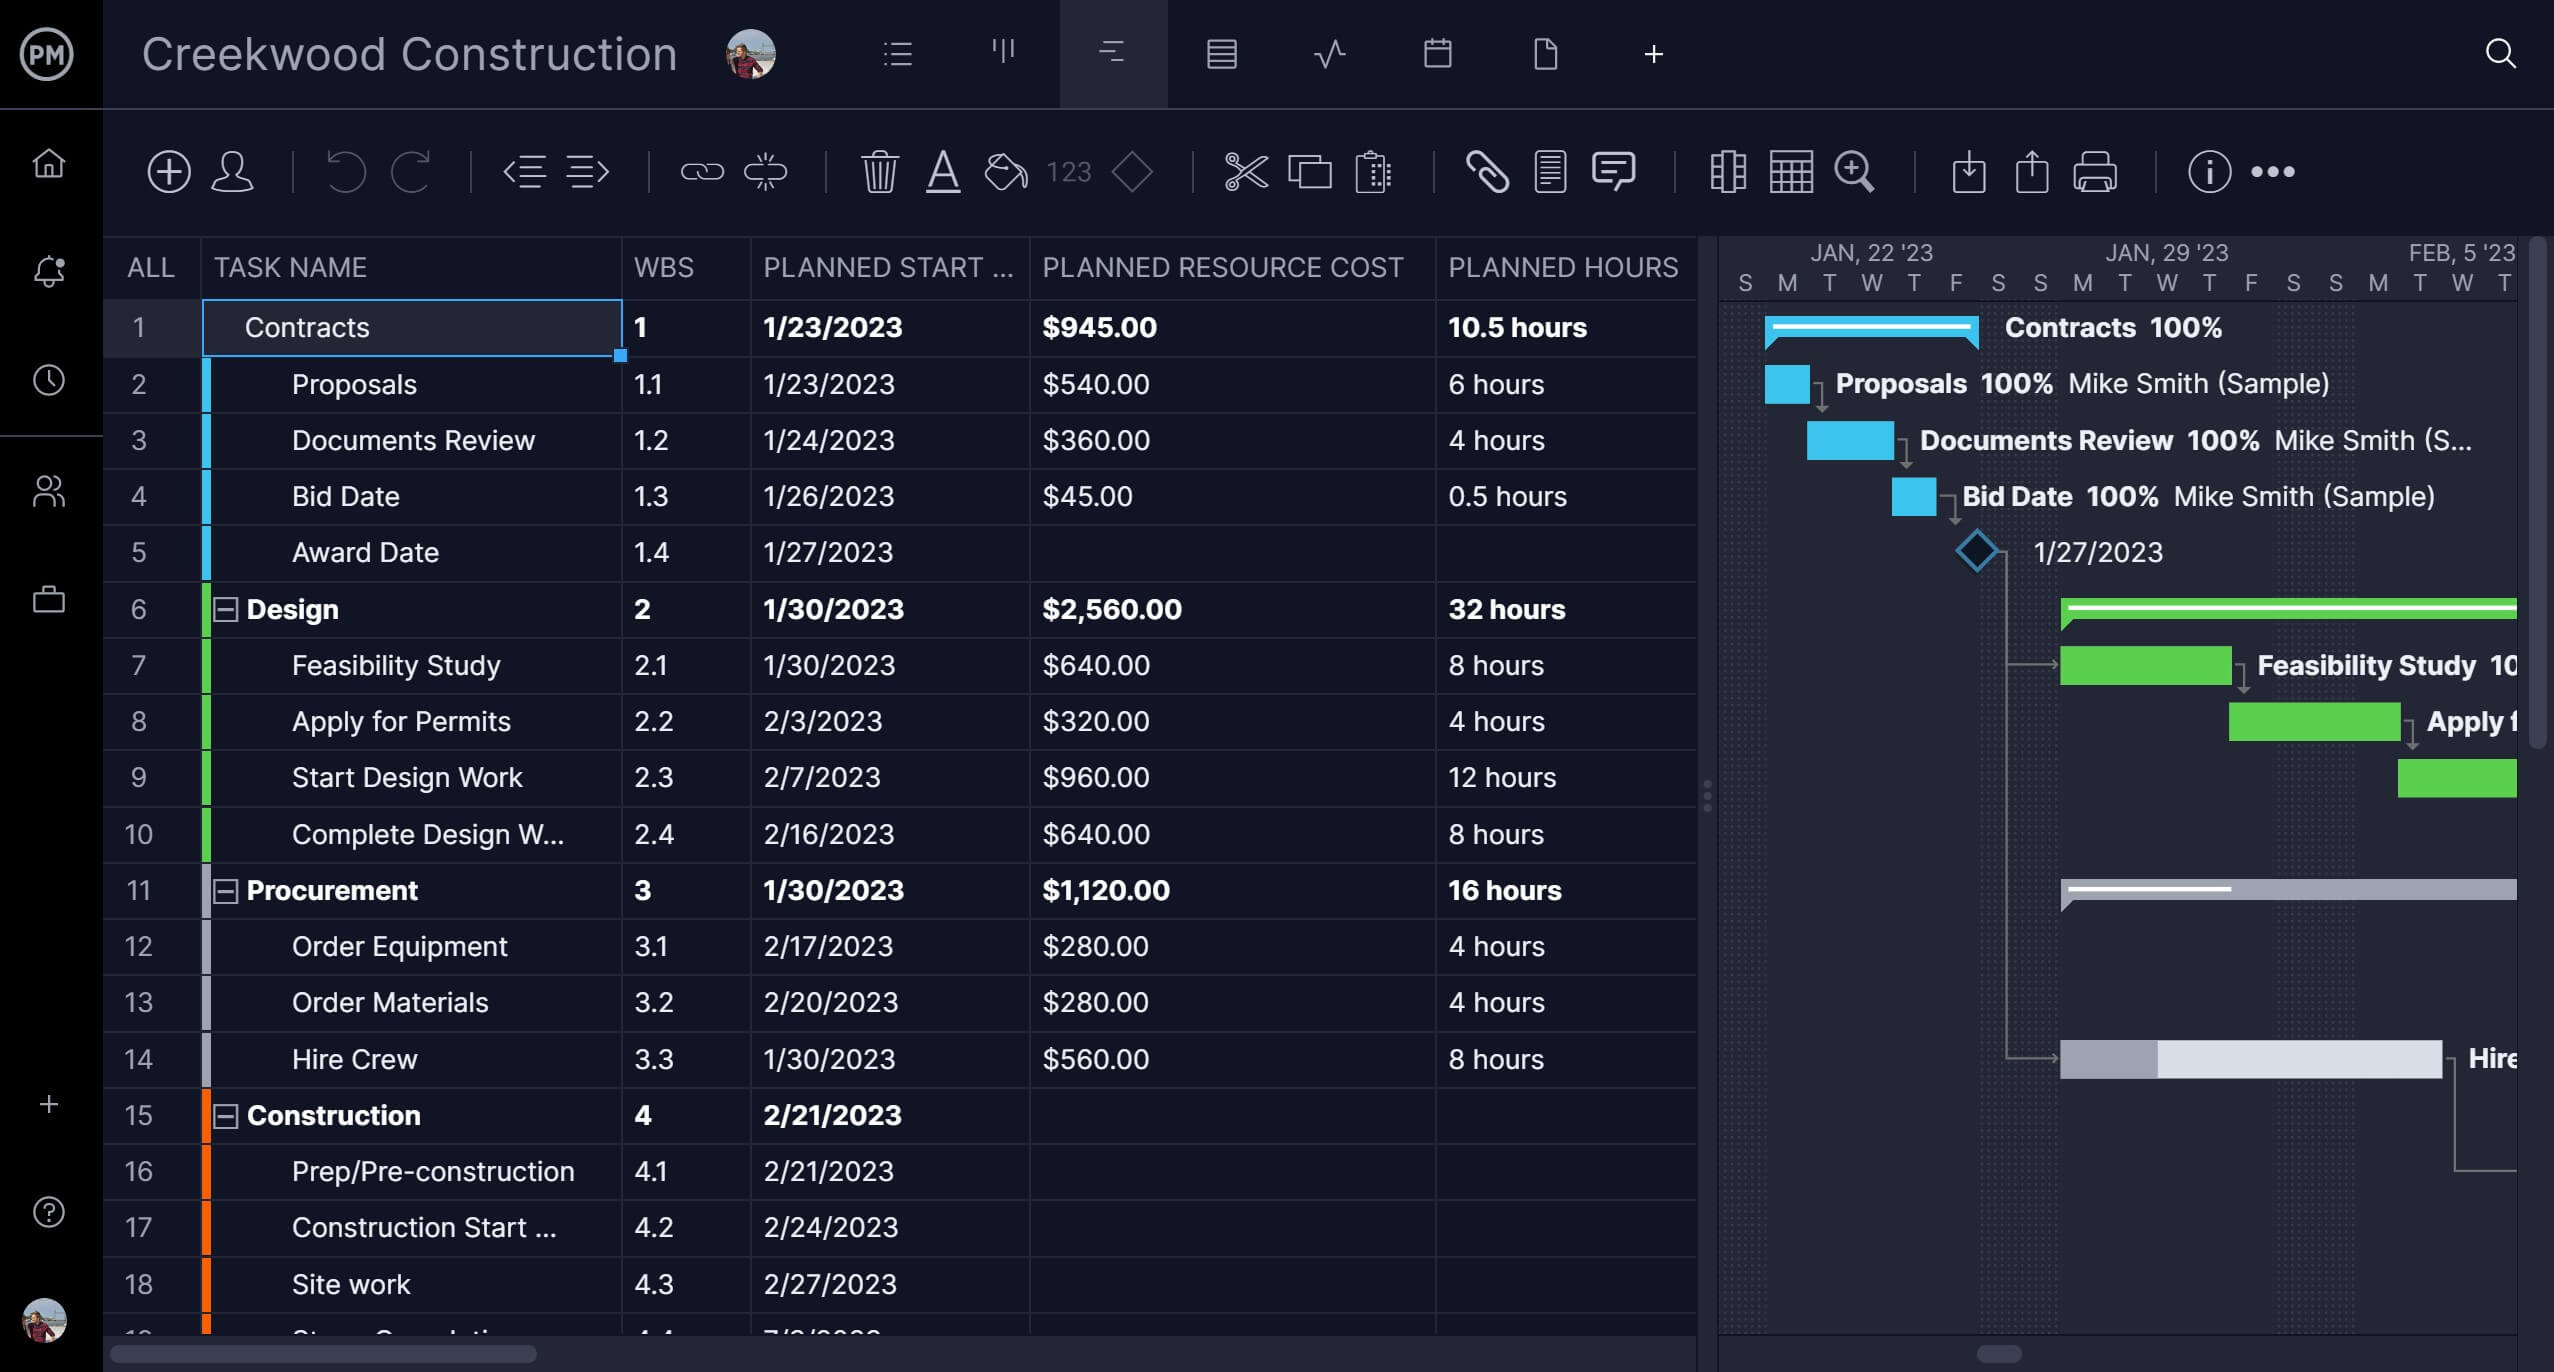
Now let’s look at what ProjectManager can do when you use your Monday.com Gantt chart in our software. For one thing, our Gantt chart seamlessly integrates with the rest of our project tools. You can share the Gantt chart with your team and stakeholders, track progress and performance on real-time dashboards and even auto-fill timesheets.
But before we start showing off the features of the Gantt chart, let’s focus on what our Gantt chart can do. It’s a powerful tool unto itself, which is cheaper than the 40-percent price increase that Monday.com implemented in 2022. With our software, it’s easier to onboard and train your team and it has impressive reporting functionality. You can’t even link tasks between boards or add holidays to know your team’s availability. Here are some other noteworthy aspects of our Gantt charts.
Set Milestones for Your Progress
Milestones are important dates in your project and they show up on our Gantt chart as diamond icons. Simply point and click when you want them. They’re great to indicate important deliverables, such as delivering the project plan to the client for approval. Traditionally, they’re used to mark the end or the beginning of a project phase. This is helpful in that it allows you to track your progress and make sure you’re keeping to the schedule.
Filter By Priority, Dependency and Tags
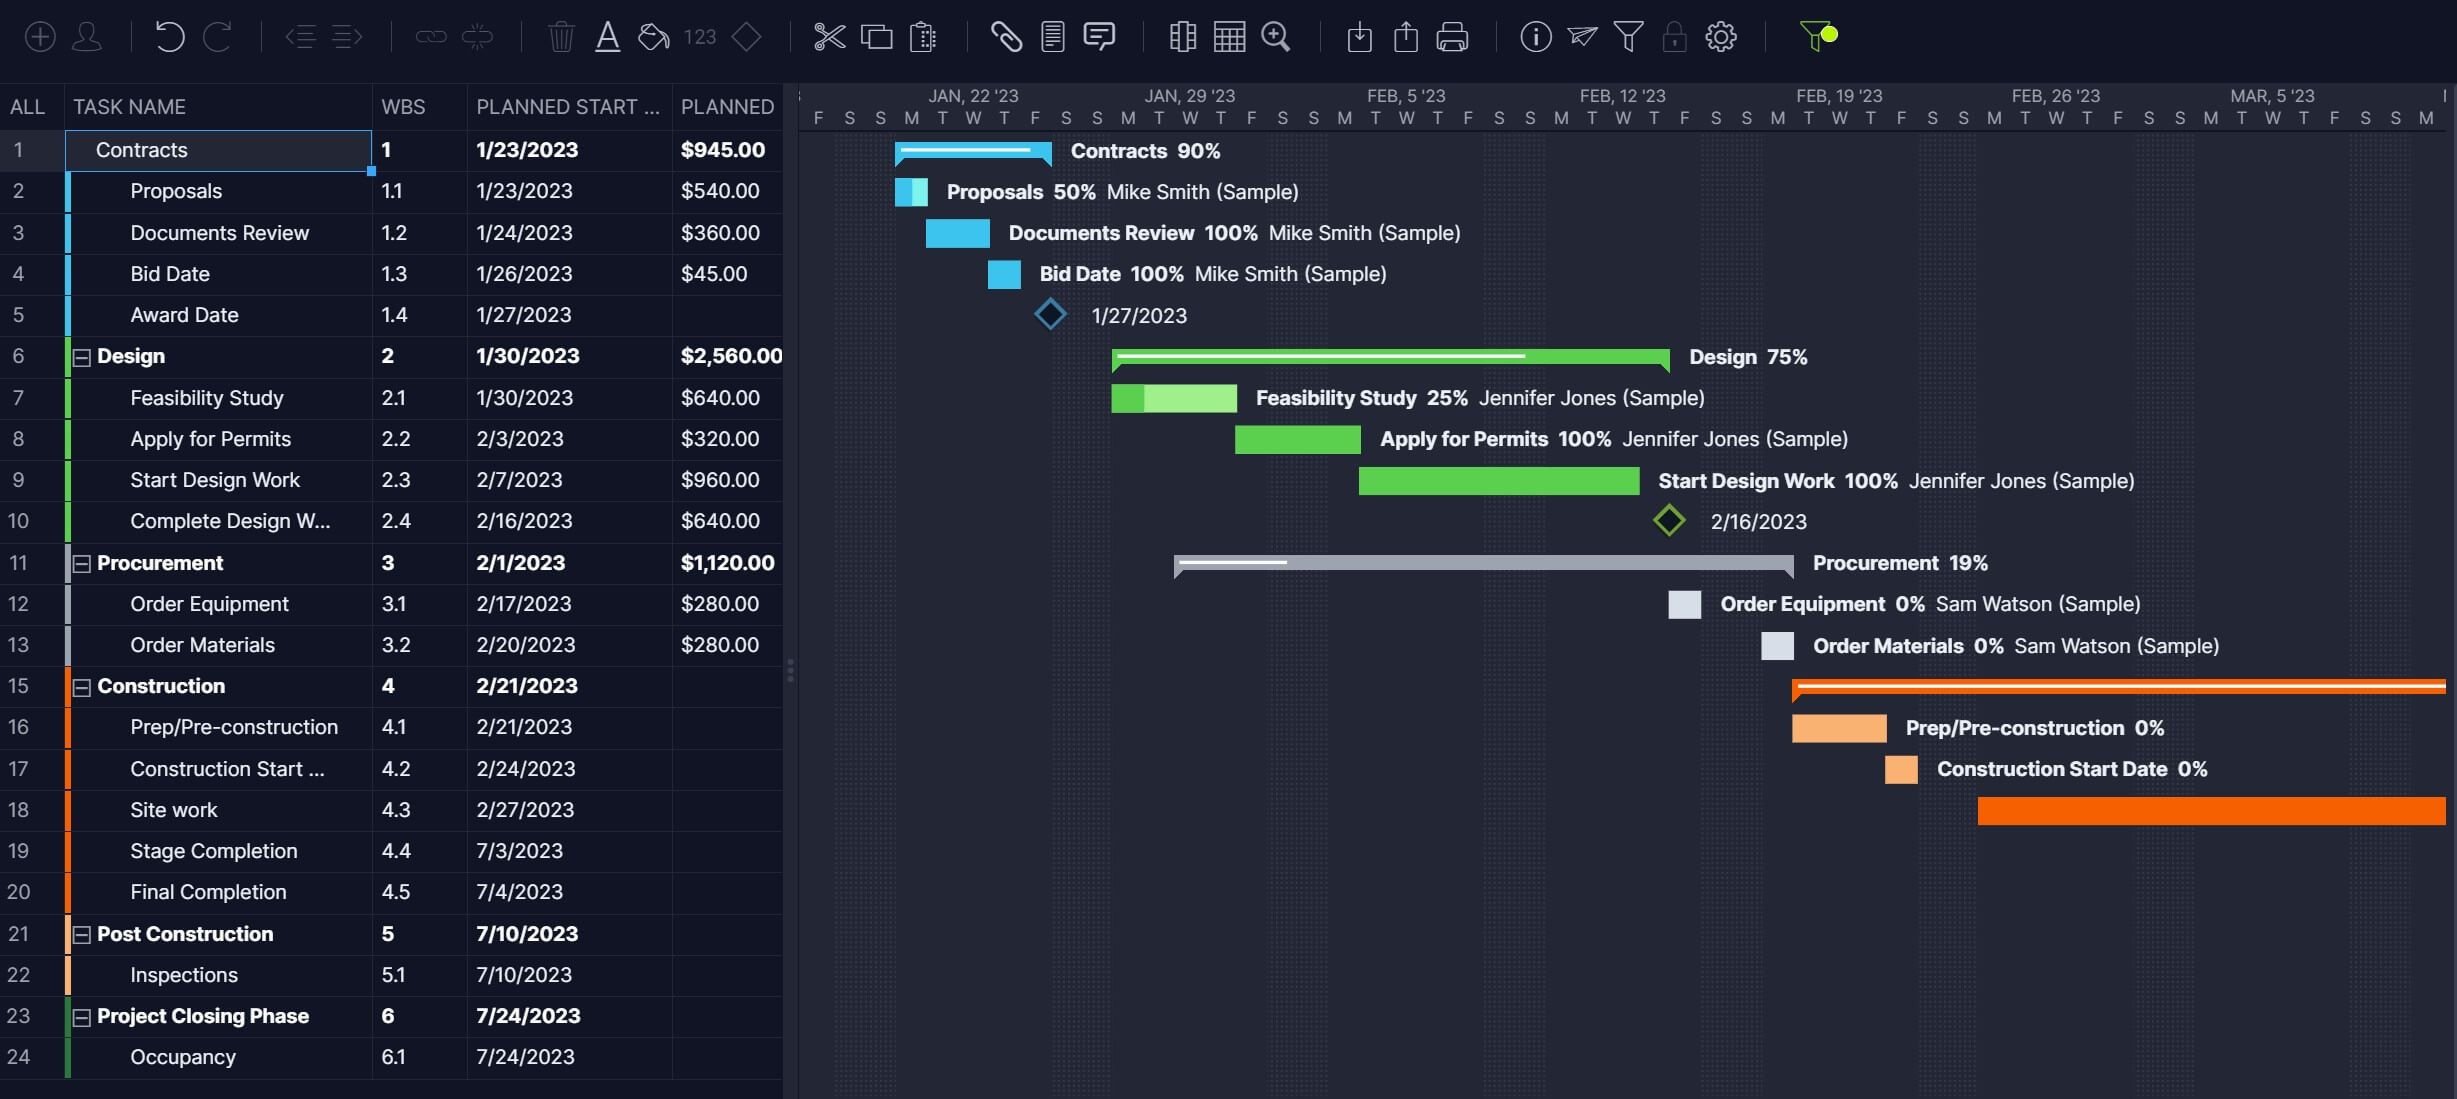
A big difference between Monday.com and ProjectManager is when you want to link task dependencies or work that can’t be done until another task is either started or finished. Our software makes it easy to link dependent tasks, Monday.com doesn’t. We also allow you to link all four types of dependencies. There are also customized tags, priority levels and more you can add to tasks to make them easier to find. Just filter the Gantt chart by what you want to see, such as the critical path in the screenshot below. It’s that easy.
Our Gantt Chart is All Yours
What a pleasure it is to use a Gantt chart that works with you instead of against you. Monday.com’s Gantt charts are one in a long line of difficult Gantt charts. Remember, people used to make these by hand. Even on a spreadsheet, they’re complicated and aggravating to edit and almost impossible to share. You don’t want multiple copies with different data floating around.
You’ll find none of those roadblocks when you plan, manage and track your project on our software. Our Gantt chart is easy to share. You can edit by simply dragging and dropping. All associated tasks automatically update to reflect the change. You can add color to make it easier to see the different project phases and much more.
Get Notified of Progress
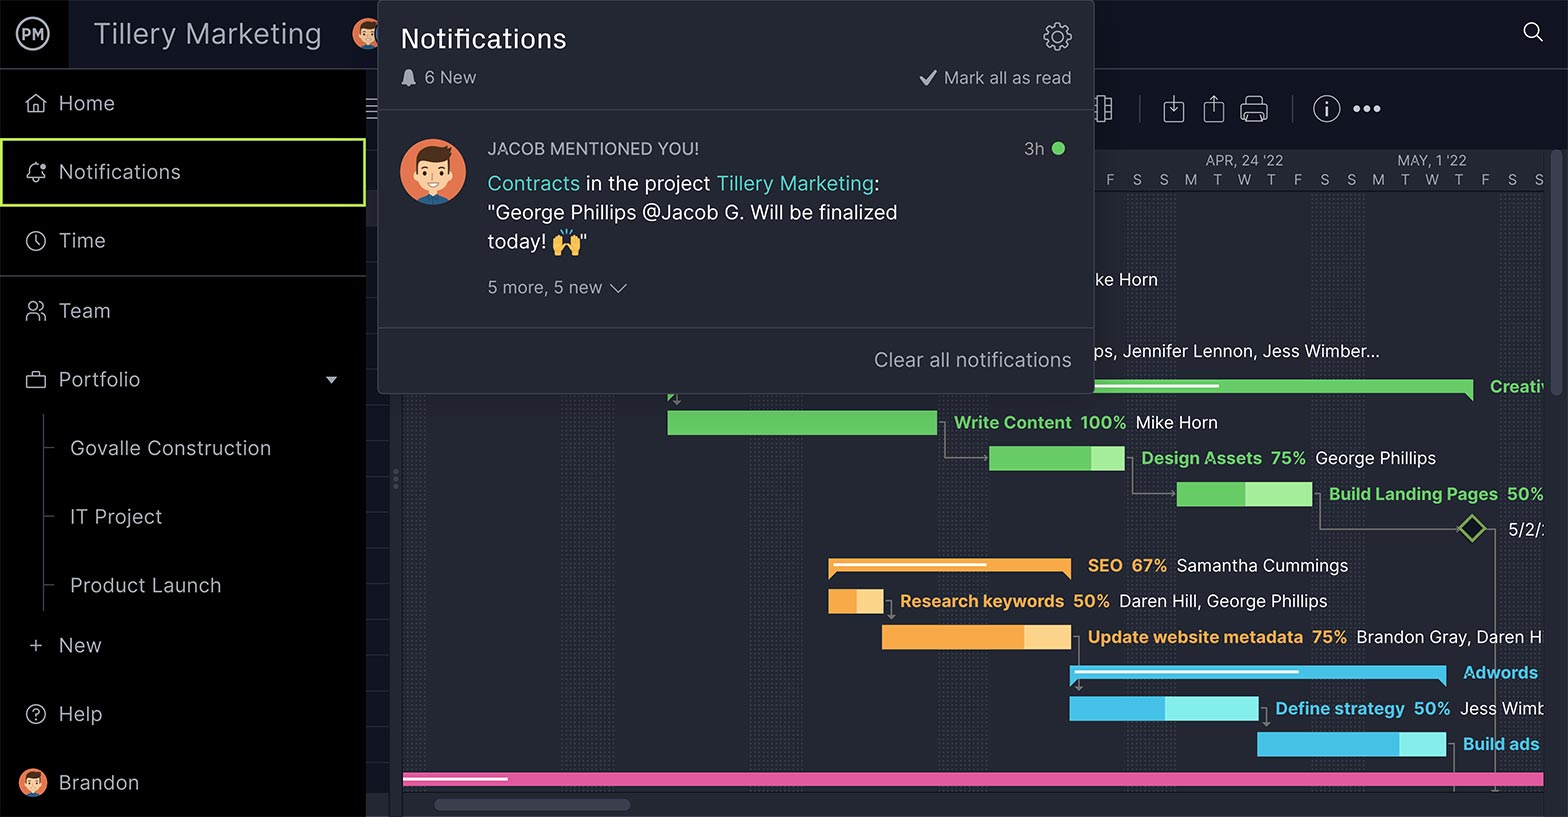
Because our software is online, our Gantt chart always has up-to-date information that is shared across our multiple project views. You’re always working on the same page as your teammates, whether they’re in the next office or next time zone. You can share files, comments and more to foster collaboration. For example, anytime the Gantt is changed or a task is commented on, you’re instantly notified by email and there’s even an in-app alert so you don’t have to leave the tool.
Other Project Management Features From ProjectManager
Now that you’re loving our Gantt chart, why not take a look around the software and see what else we have to offer? You can set availability when you onboard your team to make assignments easier, balance the team’s workload to keep them working at capacity, boost productivity and so much more.
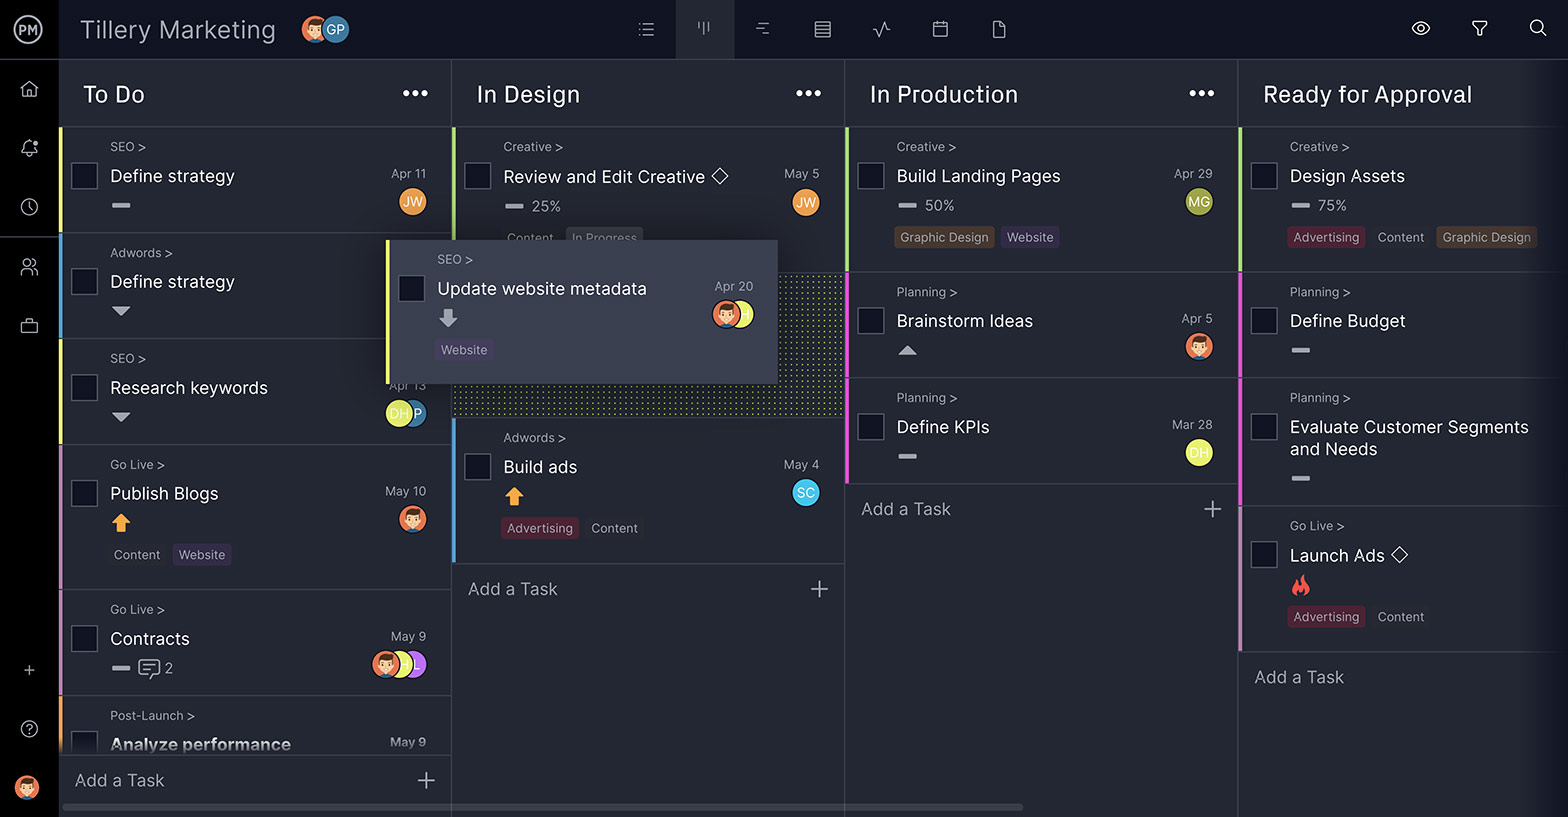
Kanban Boards
While project managers love Gantt charts, project teams don’t need that level of engagement with the project. They want to do their tasks, which is why we have multiple project views, such as task lists, calendars and the visual workflow tool of a kanban board. The kanban board lets teams manage their backlog and plan sprints together, while project managers get visibility into their work and can reallocate resources to remove roadblocks to keep the team working uninterrupted.
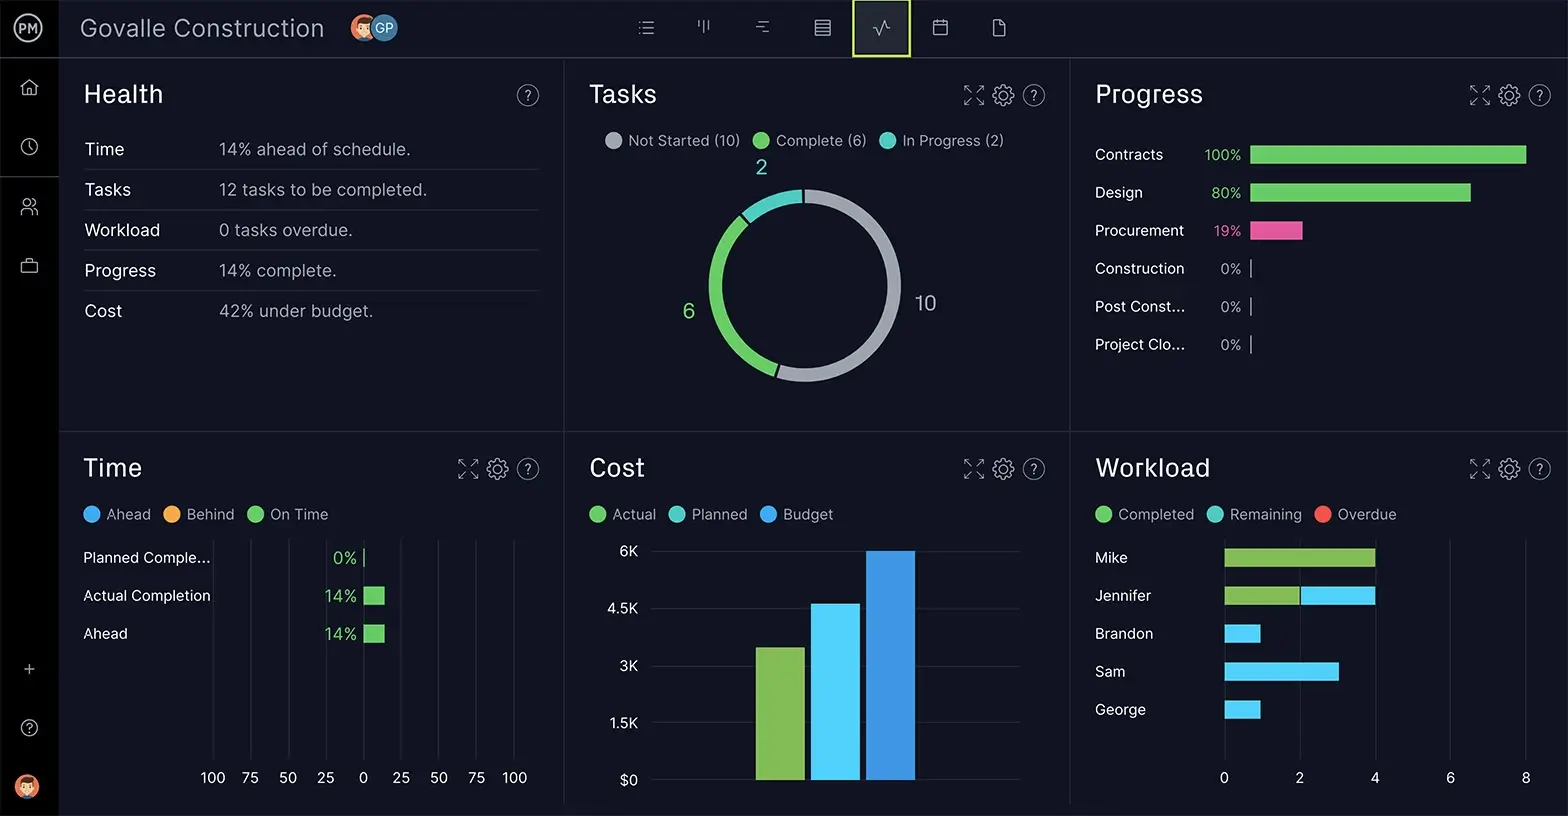
Real-Time Dashboard
We’ve talked a little about the real-time dashboard, which automatically collects live project data and displays it on easy-to-read graphs and charts. It gives you a high-level overview of the project’s progress and performance across a number of key metrics, such cost, time and much more. Most project management software makes you build your own dashboard, which takes time away from managing the project. Not our software. ProjectManager has a dashboard that’s ready to go whenever you toggle over to view it.
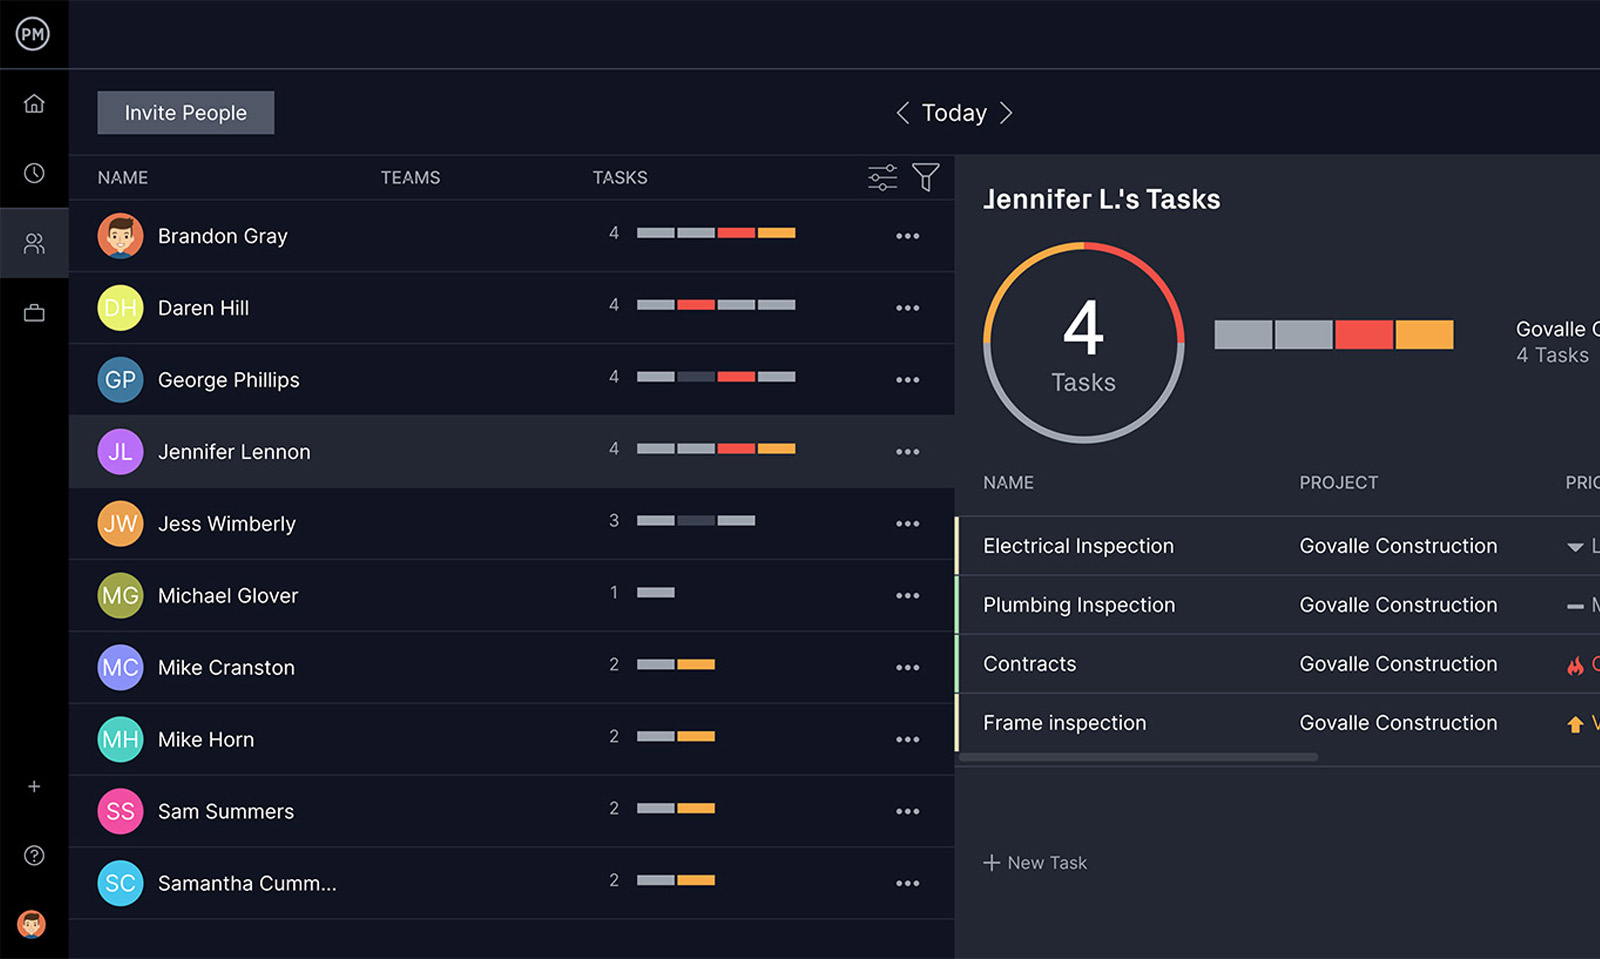
Team Management
Resource management is another key feature of our software. As we noted, we make it easy to onboard your team, define their skills and chart their availability, including PTO, vacation and global holidays for distributed teams. Once you’ve assigned the team, toggle over to the team page and get an overview of everyone on the team and see what they’re working on. To go deeper, there’s a workload chart where you can reallocate your team’s resources to keep them balanced and secure timesheets to see how far they’ve gone in completing their tasks.
Related Content
ProjectManager has more powerful Gantt charts than Monday.com. Our Gantt charts do more, do it better and do it seamlessly with our other project management features. If you need a Gantt chart, but also kanban boards, task lists, calendars and more you’ve come to the right software solution. Add to that our robust risk management, task management and resource management features and we give you the control you need to deliver successful projects. Get started with ProjectManager today for free.


