


Project scheduling can be complicated because it involves coordinating tasks, deadlines and dependencies. To manage this complexity, project managers use various project scheduling techniques to plan and control timelines effectively.
One of the most trusted methods is PERT analysis, which helps estimate project duration by accounting for uncertainty in task completion times and providing a structured way to organize and visualize project activities.
What Is PERT Analysis?
PERT analysis is a project scheduling technique that stands for Program Evaluation and Review Technique. It helps project managers estimate how long a project will take by analyzing the time required for individual tasks and accounting for uncertainty.
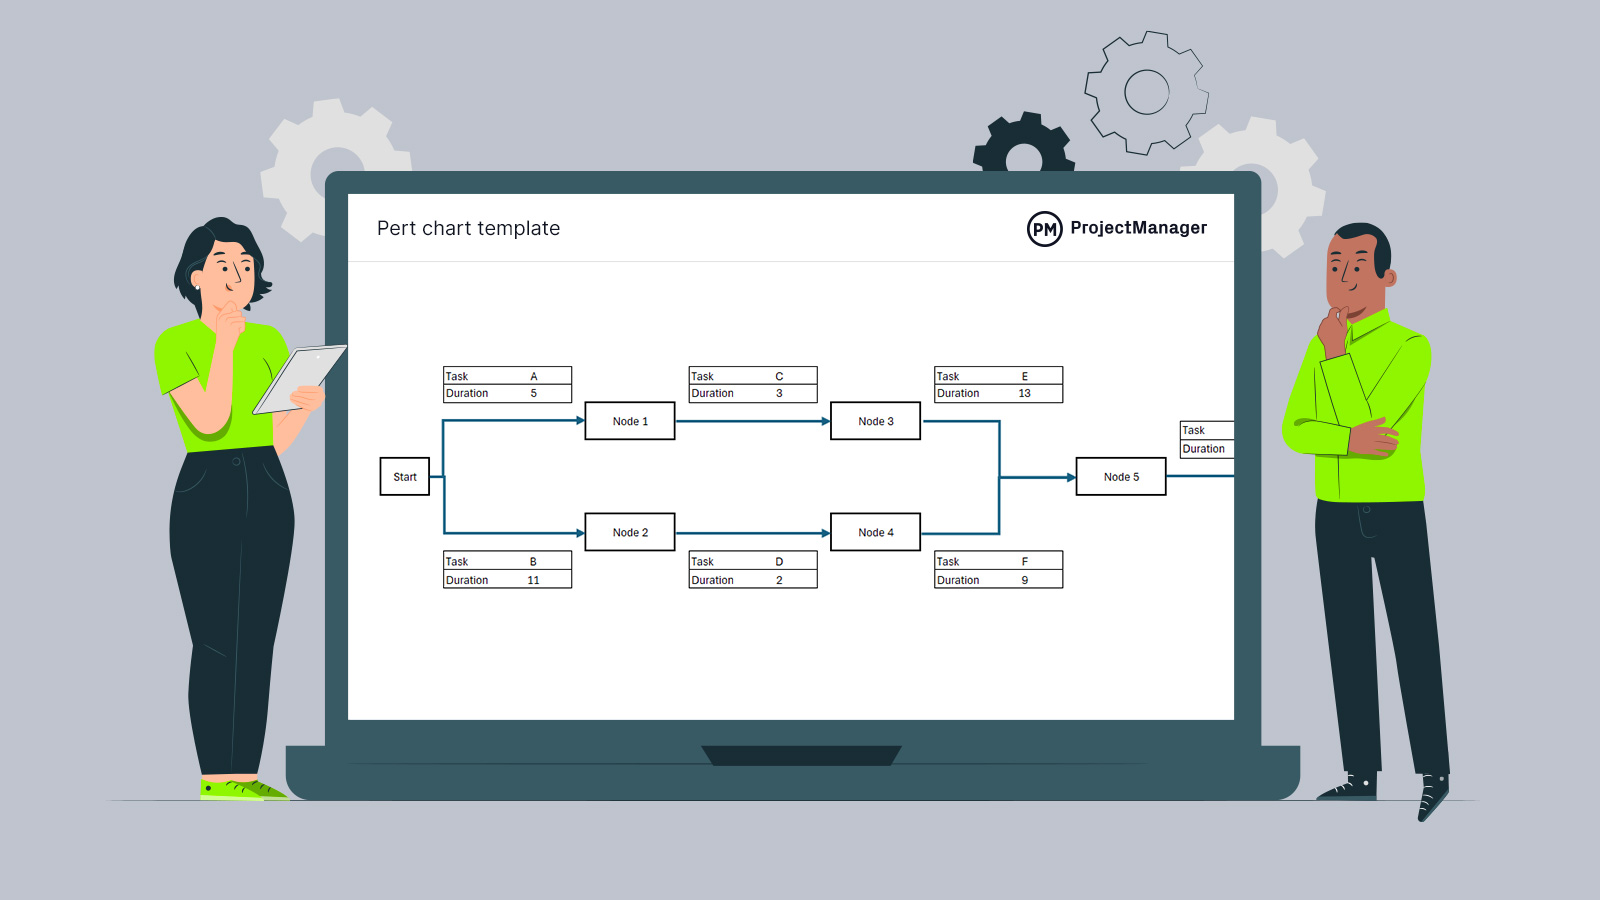
PERT analysis uses a diagram, called a PERT chart or PERT diagram, where tasks are represented by arrows and milestones or deliverables by nodes. Another important aspect of PERT analysis is the use of three time estimates for each project task, an optimistic, pessimistic and most likely duration.
By incorporating three time estimates for each task PERT analysis strives to produce a realistic and balanced project timeline. This approach accounts for potential variability and uncertainty, rather than assuming ideal conditions. As a result, project managers can plan more effectively, anticipate risks and set expectations that are achievable and grounded in the realities of the work.
Using project management software to conduct PERT analysis significantly improves accuracy, efficiency and adaptability. Instead of manually calculating time estimates and dependencies, software automates these calculations and presents data visually—saving time and reducing errors. It also allows teams to easily adjust task durations, update dependencies and factor in uncertainty, giving a more realistic view of project timelines. With integrated collaboration tools, stakeholders can provide input on estimates and assumptions in real time, making the PERT analysis more informed and actionable.
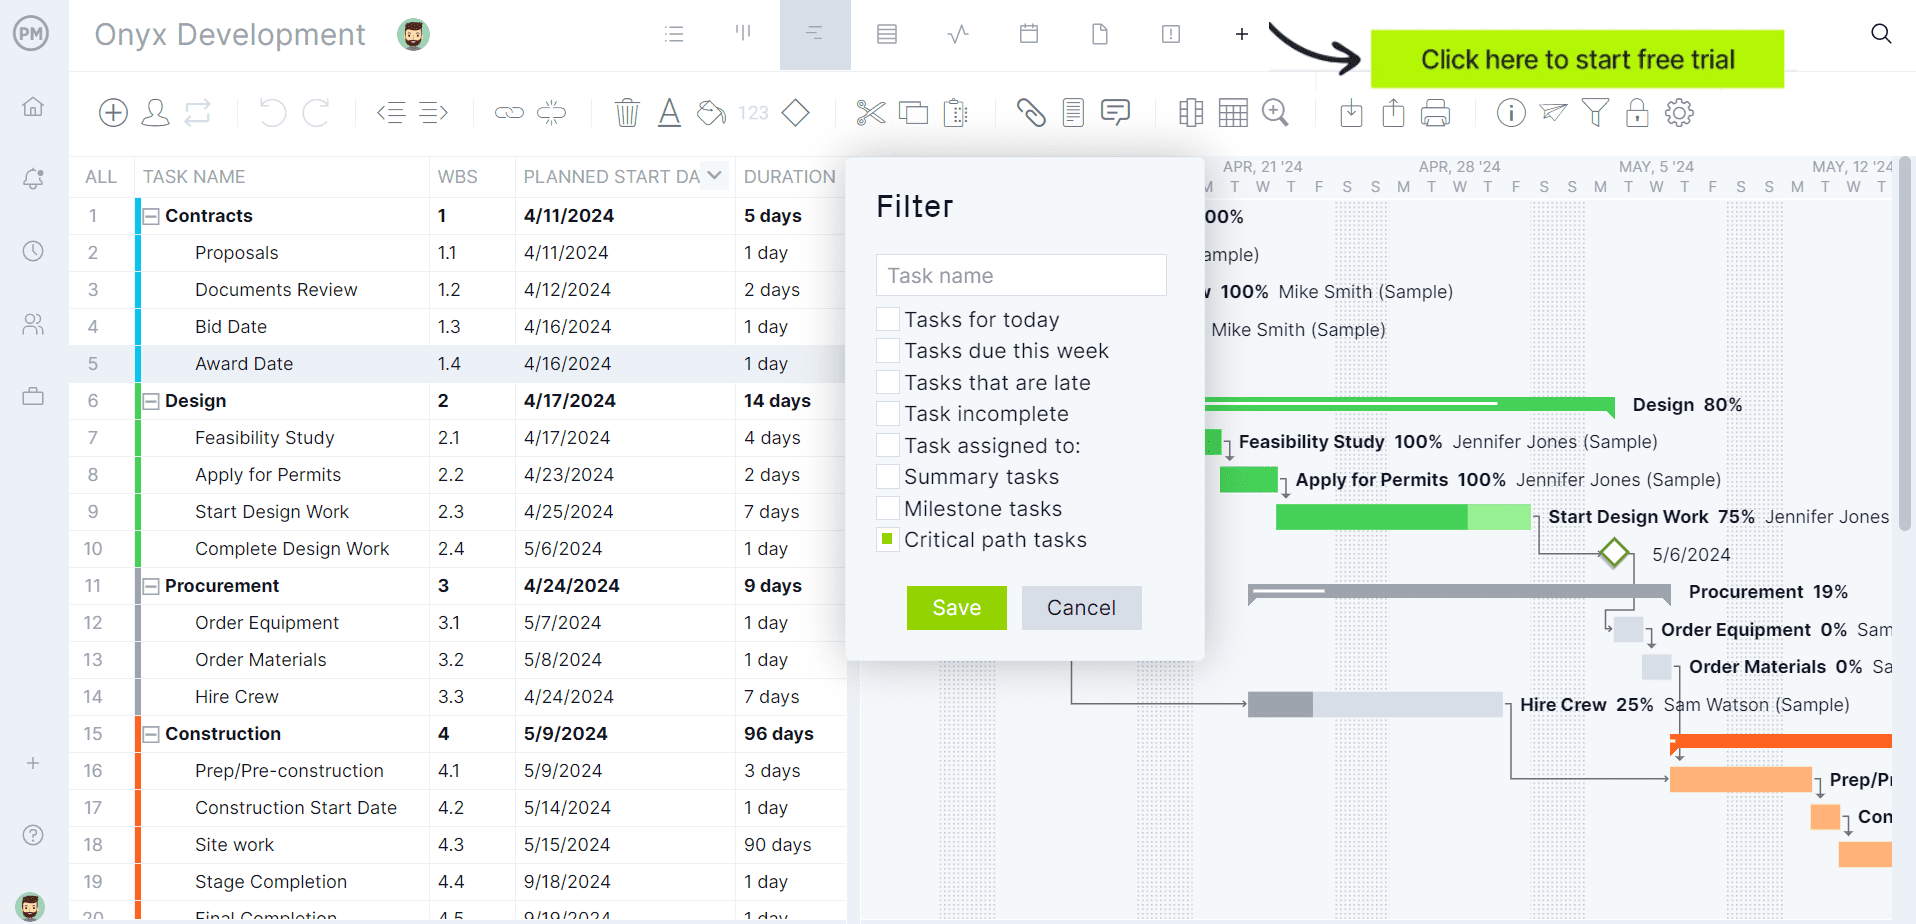
ProjectManager is award-winning project and portfolio management software with Gantt charts that are especially effective for PERT analysis because it allows users to visually link tasks, manage all four dependency types and apply multiple time estimates to assess best-case, worst-case and most likely scenarios. It filters for the critical path so you can focus on the tasks that directly impact your project’s finish date. With built-in features for baselining and tracking actual progress, ProjectManager turns static estimates into dynamic forecasts—keeping your project aligned with real-world execution. Get started with ProjectManager today for free.
PERT Analysis Formula
The PERT analysis method also includes a formula to calculate the expected duration of a task, based on the three time estimates discussed above:
- Optimistic time (O): The shortest time in which a task can be completed if everything goes better than expected
- Most likely time (M): The best estimate of the time required to complete a task, assuming normal conditions and no major problems
- Pessimistic time (P): The longest time a task might take if significant problems or delays occur
- Expected time (E): The weighted average of the three estimates, calculated using the PERT formula to predict the most realistic task duration
The PERT formula to calculate the expected duration (E) of a task is:
E = (O + 4 * M + P) / 6
This formula provides a weighted average that balances uncertainty, making project planning more realistic and reliable. The PERT diagram and formula work together to improve accuracy in scheduling.
PERT Analysis Steps
To perform PERT analysis effectively, you need to follow a series of clear steps. These steps help you break down the project, estimate task durations and calculate a realistic timeline. Below are the main steps to guide you through applying PERT analysis to plan and manage your project successfully.
1. Create a Project Task List
The first step in PERT analysis is to identify and list all the tasks required to complete the project. This ensures nothing is overlooked and every activity is accounted for. Ideally, you should begin by creating a work breakdown structure (WBS) beforehand. The WBS organizes the project into manageable deliverables and work packages, making it easier to extract a comprehensive and structured task list to use in the PERT analysis.
2. Make 3 Time Estimates for Each Task
The next step in PERT analysis is to make three time estimates for each project task: optimistic, most likely and pessimistic.
These estimates reflect the best-case, expected and worst-case scenarios, helping account for uncertainty in scheduling. Providing realistic estimates for all tasks ensures that the project timeline is based on thoughtful analysis rather than assumptions, making it more accurate and dependable overall.
3. Use the PERT Analysis Formula
Once the three time estimates are established for each task, it’s time to apply the PERT analysis formula explained above to calculate the expected duration.
E = (O + 4 * M + P) / 6
Additionally, you can calculate the variance for each task using the formula:
Variance = ((P – O) / 6) ^ 2
The variance measures the level of uncertainty or risk associated with each task’s duration, allowing you to identify tasks with greater variability and plan for potential delays accordingly.
Get your free
PERT Chart Template
Use this free PERT Chart Template to manage your projects better.
4. Identify Task Dependencies, Project Deliverables and Milestones
The next step in the PERT analysis process is to identify all task dependencies, project deliverables and milestones, as this will set the stage for drawing a PERT diagram.
In a PERT diagram, tasks and their dependencies are represented by arrows, illustrating the sequence and flow of work. Deliverables and milestones appear as nodes, marking the start, completion and significant events of the project.
Understanding which tasks depend on others and where key milestones occur ensures that the diagram accurately reflects the project’s structure. Identifying these elements beforehand is crucial for creating an effective and reliable PERT chart that accurately captures the entire project plan.
5. Draw a PERT Analysis Diagram
With tasks, dependencies, deliverables and milestones identified, you can now draw the PERT analysis diagram. Begin by placing nodes for the milestones and deliverables. Then, connect them with arrows that represent the tasks and their dependencies, following the sequence defined earlier.
Ensure that each task is linked to its predecessors and successors, creating a logical workflow. The completed diagram provides a visual representation of the project’s structure, helping you analyze timelines and plan effectively.
Related: 15 Best Scheduling Templates for Excel
6. Estimate the Total Duration of the Project and Identify the Critical Path
Once the PERT diagram is complete, use the expected time estimates and the diagram to calculate the total project duration. By following the arrows along the longest path through the network—where tasks have no slack—you identify the critical path.
This path determines the shortest possible time in which the project can be completed. Knowing the critical path allows you to focus on critical tasks, monitor progress and ensure the project stays on schedule while minimizing risks of delays.
Advantages of PERT Analysis
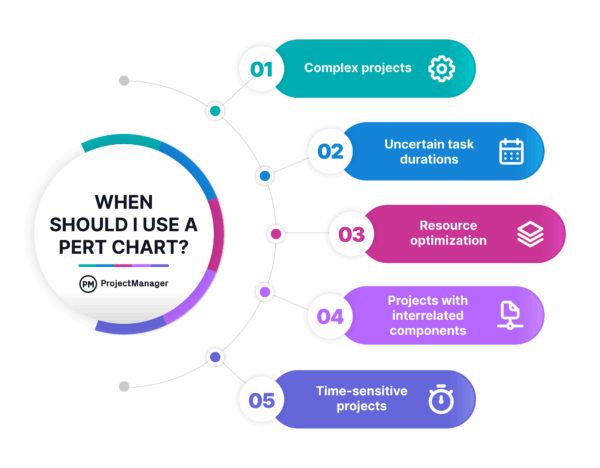
PERT (Program Evaluation and Review Technique) analysis offers a structured approach to project scheduling, especially in complex projects with uncertain timelines. By using three time estimates for each task, PERT helps project managers plan more accurately, identify risks early and make informed decisions throughout the project lifecycle.
- Improved Time Estimates: Uses optimistic, pessimistic and most likely estimates to create a realistic project timeline.
- Identifies Critical Tasks: Helps pinpoint activities that directly affect the project’s finish date.
- Supports Decision-Making: Provides data for evaluating project scenarios and planning for uncertainties.
- Visualizes Dependencies: Clarifies task relationships and sequencing through network diagrams.
- Enhances Planning for Complex Projects: Particularly useful in large or uncertain projects where precise task durations are hard to predict.
- Encourages Risk Awareness: Promotes proactive risk identification and mitigation strategies during planning.
Disadvantages of PERT Analysis
While PERT analysis can be a powerful tool for scheduling and planning, it also comes with limitations. Its complexity and reliance on estimates can lead to challenges, especially when applied to smaller projects or environments with limited data. Below are some of the main drawbacks to consider:
- Time-Consuming: Creating and updating a PERT chart, especially for large projects, can be complex and labor-intensive.
- Requires Accurate Estimates: Relies heavily on subjective time estimates, which can reduce reliability if based on poor or limited data.
- Can Be Overly Complex for Simple Projects: In smaller or less uncertain projects, PERT may introduce unnecessary complications.
- Limited Resource Consideration: Focuses primarily on time and task relationships, often overlooking resource availability and constraints.
- Static by Nature: Traditional PERT diagrams are not easily adaptable to real-time changes without project management software.
- Risk of Misinterpretation: Without a solid understanding, users may misread paths and probabilities, leading to flawed planning decisions.
How to Take PERT Analysis Further With ProjectManager
ProjectManager takes PERT analysis beyond static diagrams by offering multiple project views that make planning and execution more flexible and collaborative. While traditional PERT charts focus solely on task sequences and time estimates, our software allows teams to visualize and manage those tasks in various formats—Gantt, kanban, calendar, list and sheet views.
This flexibility supports different work styles and roles while maintaining alignment across the team. For example, the Gantt view helps define dependencies and durations in line with PERT logic, while the kanban view allows team members to track task progress more intuitively.
Manage Resources to Stay on the Critical Path
Once tasks are identified and scheduled, the platform helps assign the right people or materials using real-time availability data. Its color-coded workload charts prevent overallocation and identify capacity gaps early, ensuring that your optimistic and pessimistic time estimates are grounded in real-world resource conditions. The centralized team page makes it easy to monitor individual workloads and balance assignments, which keeps the project moving smoothly along its critical path.

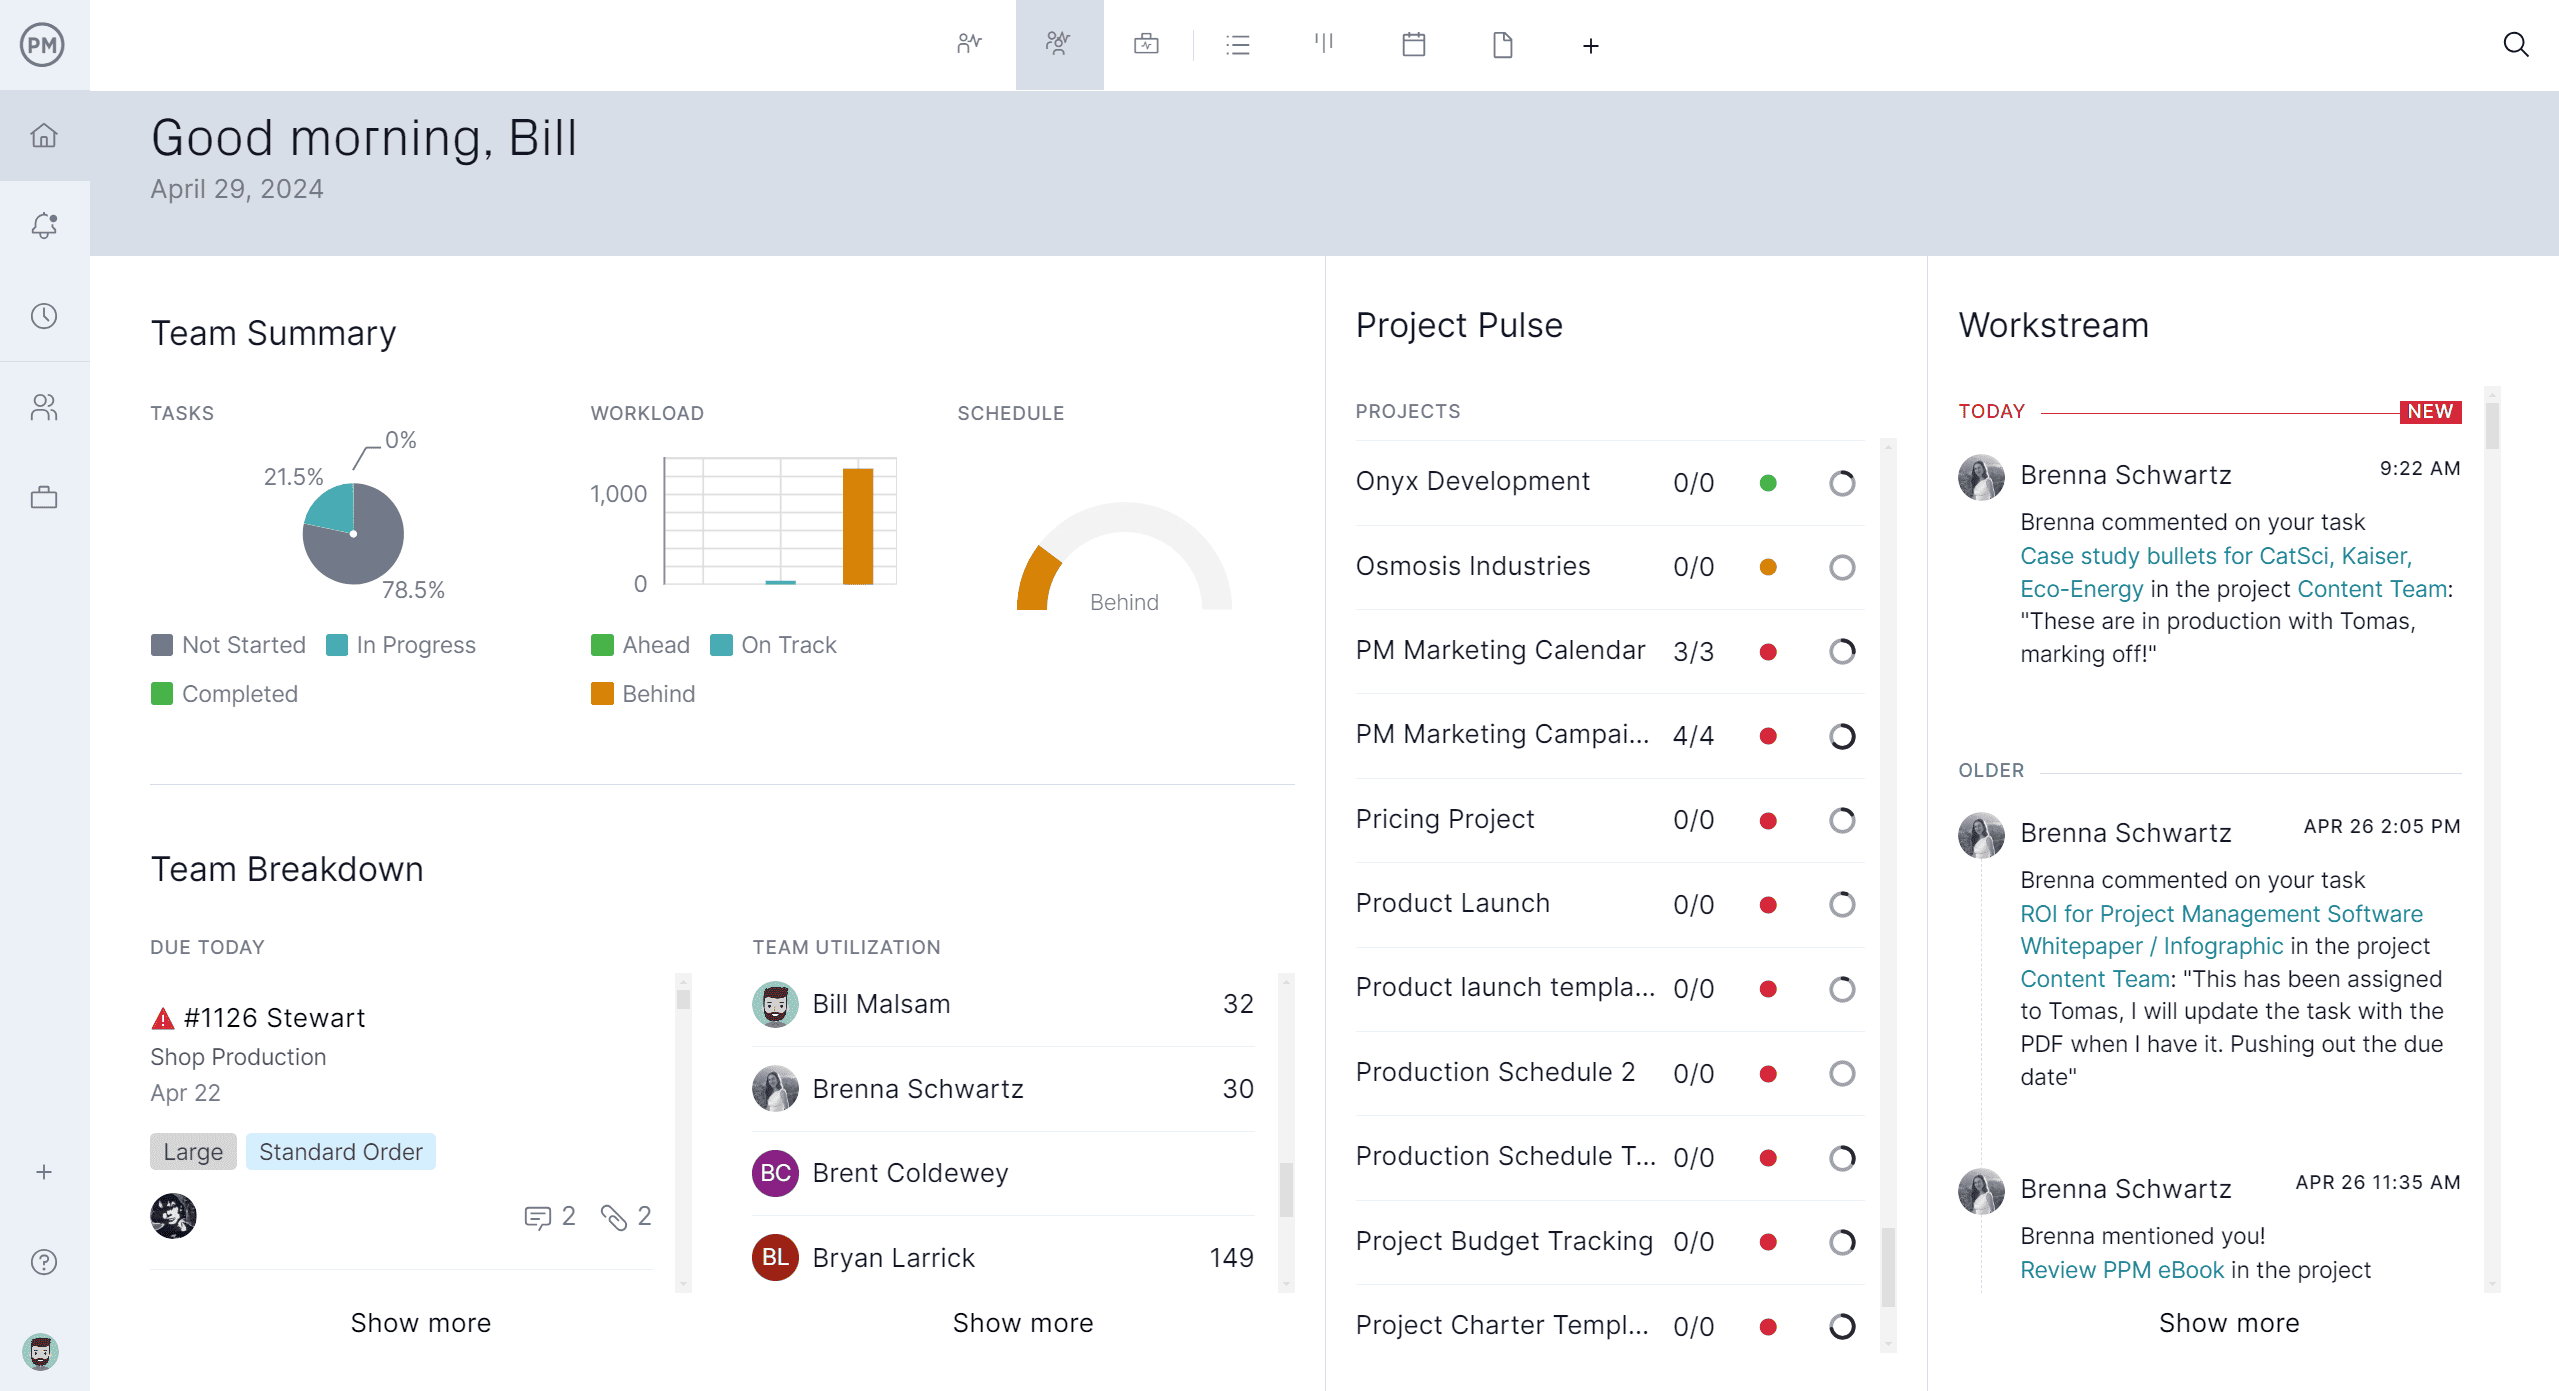
Track PERT Analysis in Real Time to Keep on Schedule
Real-time tracking features turn static PERT analysis into a dynamic, data-driven tool for managing uncertainty and change. With real-time dashboards, customizable reports and secure timesheets, teams can compare planned timelines with actual progress and adjust estimates accordingly. As changes occur, our software updates all connected views automatically—keeping your schedule, resource allocation and forecasts in sync. This ongoing visibility ensures that your initial PERT-based assumptions stay relevant throughout the entire project lifecycle.
Related PERT Content
What to learn more about PERT analysis and how it helps with project management? Below are a few links that will take you to our ultimate guide, a blog on how PERT and the critical path method differ and much more.
ProjectManager is online project and portfolio management software that connects teams whether they’re in the office or out in the field. They can share files, comment at the task level and stay up to date with email and in-app notifications. Join teams at Avis, Nestle and Siemens who are using our software to deliver successful projects. Get started with ProjectManager today for free.


