


Processes benefit businesses, enterprises and the field of project management, and one of the most important aspects of a successful process is seeing the process flow drawn out. A process flow diagram is a great tool to outline and clarify that process to everyone involved.
But what is a process flow? We’ll explain, including the process flow diagram symbols and different types. Then, to further illustrate the advantage of using one, we’ll provide a couple of examples and throw in a free template to download.
What Is a Process Flow?
A process flow is a visual representation or diagram that shows the steps involved in a particular process. It outlines the sequences of tasks, actions or events and how they are connected or related to one another in the overall workflow.
Process flow diagrams are commonly used in various fields, such as business operations management, manufacturing, software development and project management. They help improve one’s understanding of the process, better communicate it to others and increase its efficiency.
All this adds to the clarity and understanding of complex processes, increases accountability by defining clear roles and responsibilities and helps with decision-making. From there, project management software is needed to streamline project planning and scheduling.
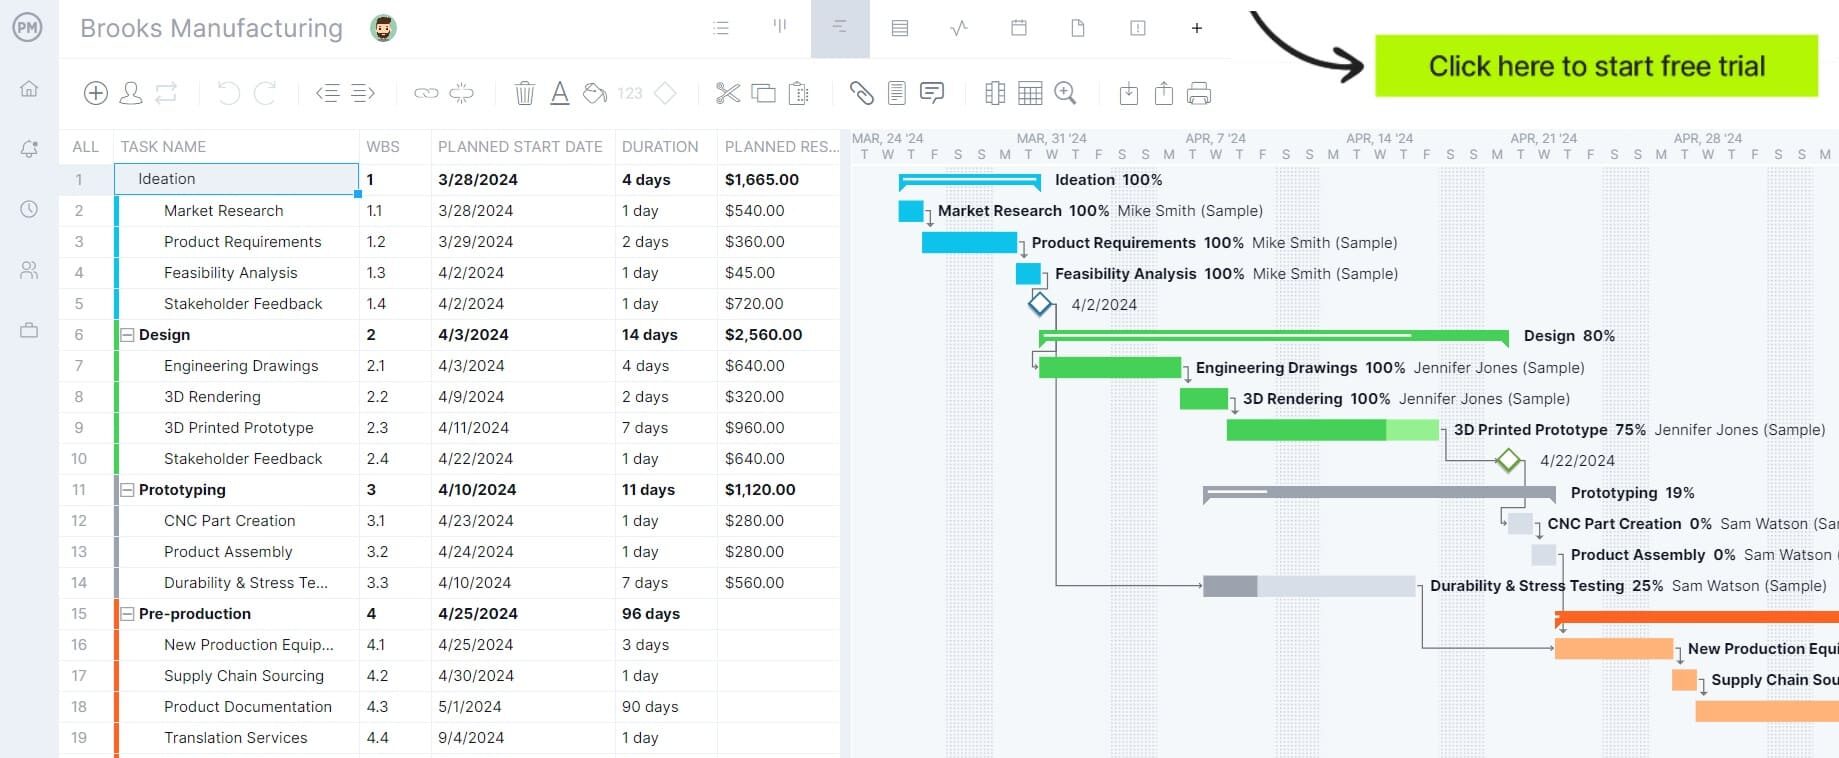
ProjectManager is award-winning project and portfolio management software with powerful Gantt charts that allow project managers to map out the entire project on a visual timeline. The tool displays tasks but also links all four types of task dependencies to avoid costly delays. The critical path can be easily found by filtering the Gantt chart and setting a baseline track progress in real time. Get started with ProjectManager today for free.
Components of a Process Flow
A process flow typically consists of several components that help define, organize and communicate the steps involved in a particular process. These components are often represented visually in process flow diagrams, such as flowcharts, to ensure clarity and easy understanding. Here are the key components of a process flow.
- Inputs: Resources, data or material required to initiate or complete a task or process. They are what one starts with and needs to move through a particular step in the process.
- Steps/Activities: Represent individual tasks or actions that must be completed in the process. Each step typically transforms inputs or moves the process forward towards completion.
- Decisions: A point in the process flow where a choice or judgment must be made. The process may follow different paths based on evaluating certain conditions or criteria.
- Outputs: The results or products produced by the process. These are the outcomes generated by completing the steps or activities.
- Entities: Represent the people, departments, systems or external factors involved in or impacted by the process. They are the actors or resources that either perform tasks, provide inputs or receive outputs.
- Flow Paths: The directional arrows that connect the different components of the process, illustrating the sequence and flow of activities, decisions, inputs, outputs and interactions between entities.
Get your free
Process Flow Diagram Template
Use this free Process Flow Diagram Template to manage your projects better.
Common Types of Process Flow
Different types of process flows are designed to manage and streamline operations in various industries and sectors. Below are descriptions of some common types of process flows.
Business Process Flow
This refers to the sequence of activities and tasks a company or organization follows to achieve a specific business objective or outcome. It can encompass both operational and strategic processes within a business. Business process flows help organizations optimize workflows, improve efficiency and ensure consistent and high-quality outputs in business operations. Examples include the sales process flow, customer support process flow and employee onboarding process flow.
Manufacturing or Production Process Flow
These are the sequence of steps involved in creating a product, from raw material acquisition to final product delivery. This type of process flow is used in industries like manufacturing, assembly and production to streamline operations, optimize resources, minimize waste and ensure product quality and consistency throughout the manufacturing process. This can be seen in automobile manufacturing, food processing and electronics assembly.
Procurement Process Flow
This describes the steps an organization takes to acquire goods or services. It involves identifying needs, selecting suppliers and managing contracts to ensure the organization obtains the required resources at the best value. It ensures that businesses acquire the necessary goods and services efficiently and cost-effectively, minimizing delays and maximizing value. For example, it’s used in office supplies procurement, IT equipment procurement and raw materials procurement.
What Is a Process Flow Diagram?
A process flow diagram (PFD) is a graphical representation of a process or workflow. It visually depicts the steps, tasks or activities involved in a particular process and how they are interconnected. Process flow diagrams are commonly used in various industries to communicate processes, identify inefficiencies and design or improve workflows.
There are different types of process flow diagrams. The simplest is a basic flowchart, which shows straightforward processes with a clear sequence of steps. A cross-functional flowchart or swimlane diagram includes different lanes for each department, role or entity involved, showing how each interacts with the process at each step.
A specialized flow diagram that focuses on the data flow through a system, often used in software design or information systems is called a data flow diagram (DFD). Then there’s a workflow diagram, which focuses on tasks and decision-making in a workflow. This is commonly used for business processes.
Process Flow Diagram Symbols
In process flow diagrams, standardized symbols represent different elements of the process. These symbols make it easier to communicate complex workflows and processes, and they help ensure consistency and clarity. Below are the common process flow diagram symbols and their meaning.
- Oval: Represents the start and end points of the process
- Rectangle: Represents an action or process step that transforms inputs into outputs
- Diamond: Indicates a decision point in the process, where a yes/no or true/false condition directs the flow
- Parallelogram: Represents inputs or outputs in the process, such as data or materials entering or leaving the process
- Rectangle with a wavy bottom edge: Denotes a document created or used within the process
- Cylinder: Represents a database or data storage when the process involves storing or retrieving data from a database
- Circle: Used to connect different parts of the diagram, especially when a process flow diagram spans multiple pages or when connecting disconnected parts of the process
- Arrow: Indicates the direction or flow path of the workflow from one step to the next
- Double-line arrow or fork/join nodes: Represents simultaneous processes or tasks that can occur in parallel, called parallel mode or concurrency
- D-share (half circle): Signifies a delay or waiting period in the process flow
Process Flow Diagram Template
Rather than building one by hand, download this free process flow diagram template for PowerPoint. It has a slide that shows and defines all the symbols needed to create a unique process flow diagram.
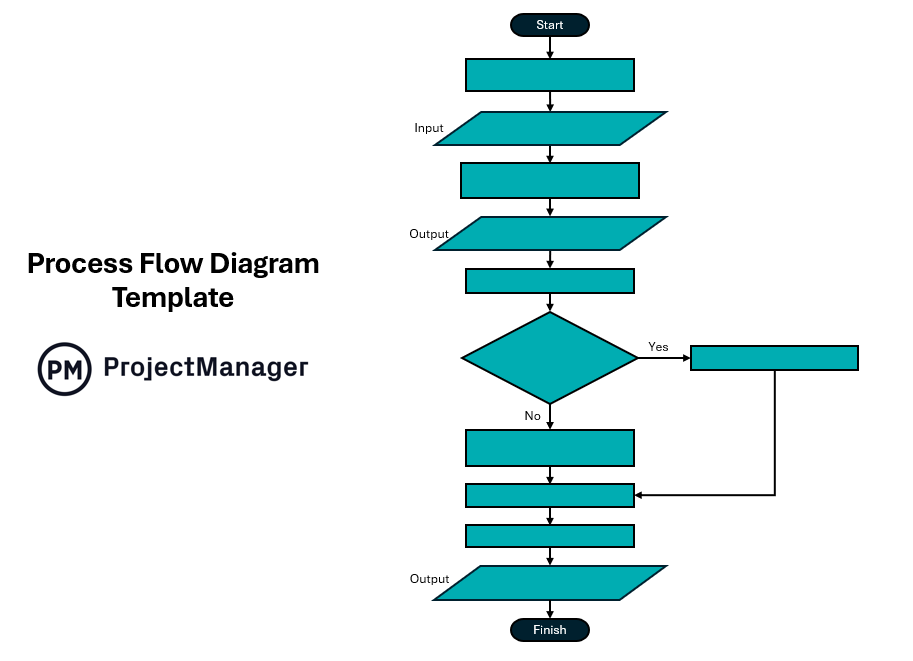
Then use arrows to connect the flowchart symbols to represent a process flow diagram. This template is fully customizable and can be used repeatedly to illustrate process flow to work more efficiently and communicate more effectively.
Process Flow Diagram Examples
We’ve written a lot about process flow, what it is and how it applies to different industries, as well as the symbols that are used when making a process flow diagram. To better understand how one works, let’s explore two process flow diagram examples, one for business and the other for manufacturing or production.
Business Process Flow Diagram
The below process flow diagram is for a specific business process, the customer service process flow. It starts with the input of a customer contact list, which leads to the output of details and issues around those customers.
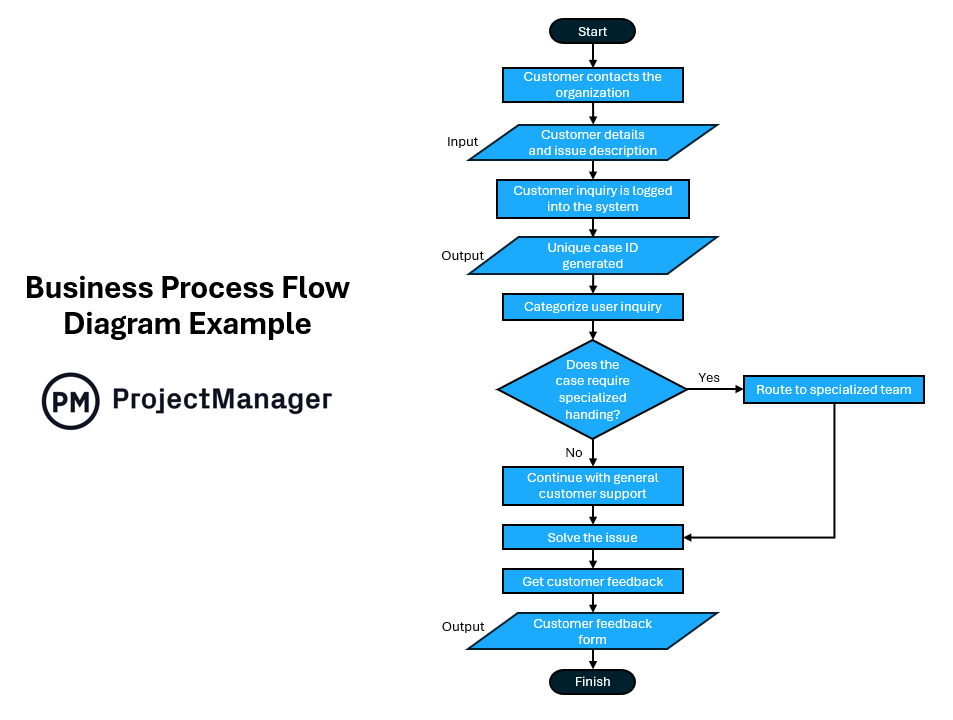
Customer inquiry is logged, unique case IDs generated and a decision is made on whether a case requires specialized handling. In our process flow example, it does and is routed to the appropriate team. The problem is solved and customer feedback is collected by issuing a feedback form.
Manufacturing or Production Process Flow Diagram
Now, let’s see what a manufacturing or production planning process flow diagram looks like. As illustrated below, it begins with the input of a production request, which leads to the output of a material requirement plan.
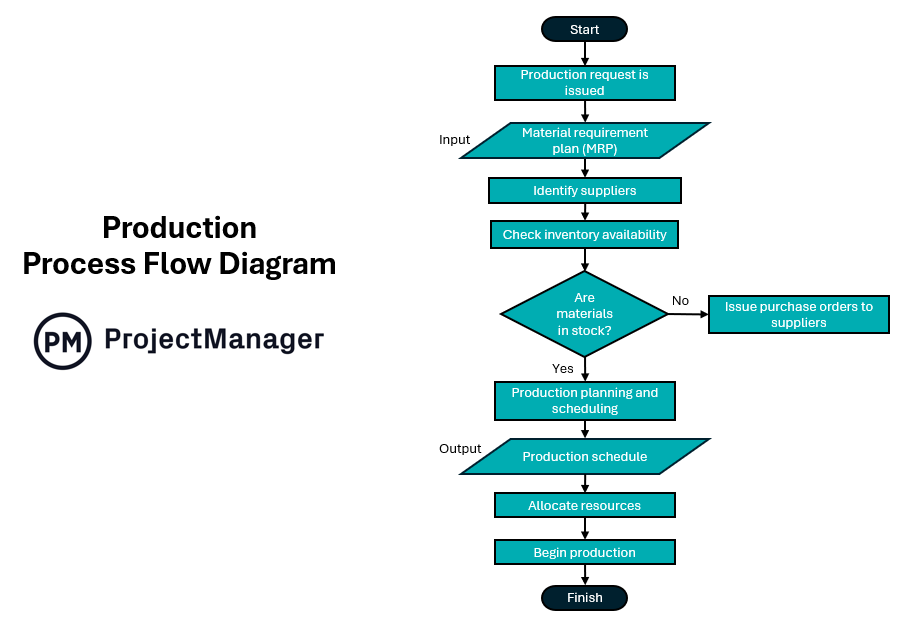
Next, suppliers are identified and inventory availability is checked. This leads to the question of whether materials are in stock. They are not. Therefore, a purchase order to suppliers is issued. If they are in stock, a production plan and schedule will be created, resources allocated and production starts.
How ProjectManager Helps Manage Process Flow
While process flow diagrams can map out and illustrate processes for businesses, projects and more, they’re not going to plan, schedule and manage that work. For that, project management software is required. ProjectManager is award-winning project and portfolio management software with multiple project views that allow managers to plan, teams to execute and stakeholders to stay informed on tools that are appropriate for their needs. But once plans and schedules are made, there’s still work to be done to manage process flow.
Monitor Time, Cost and Progress
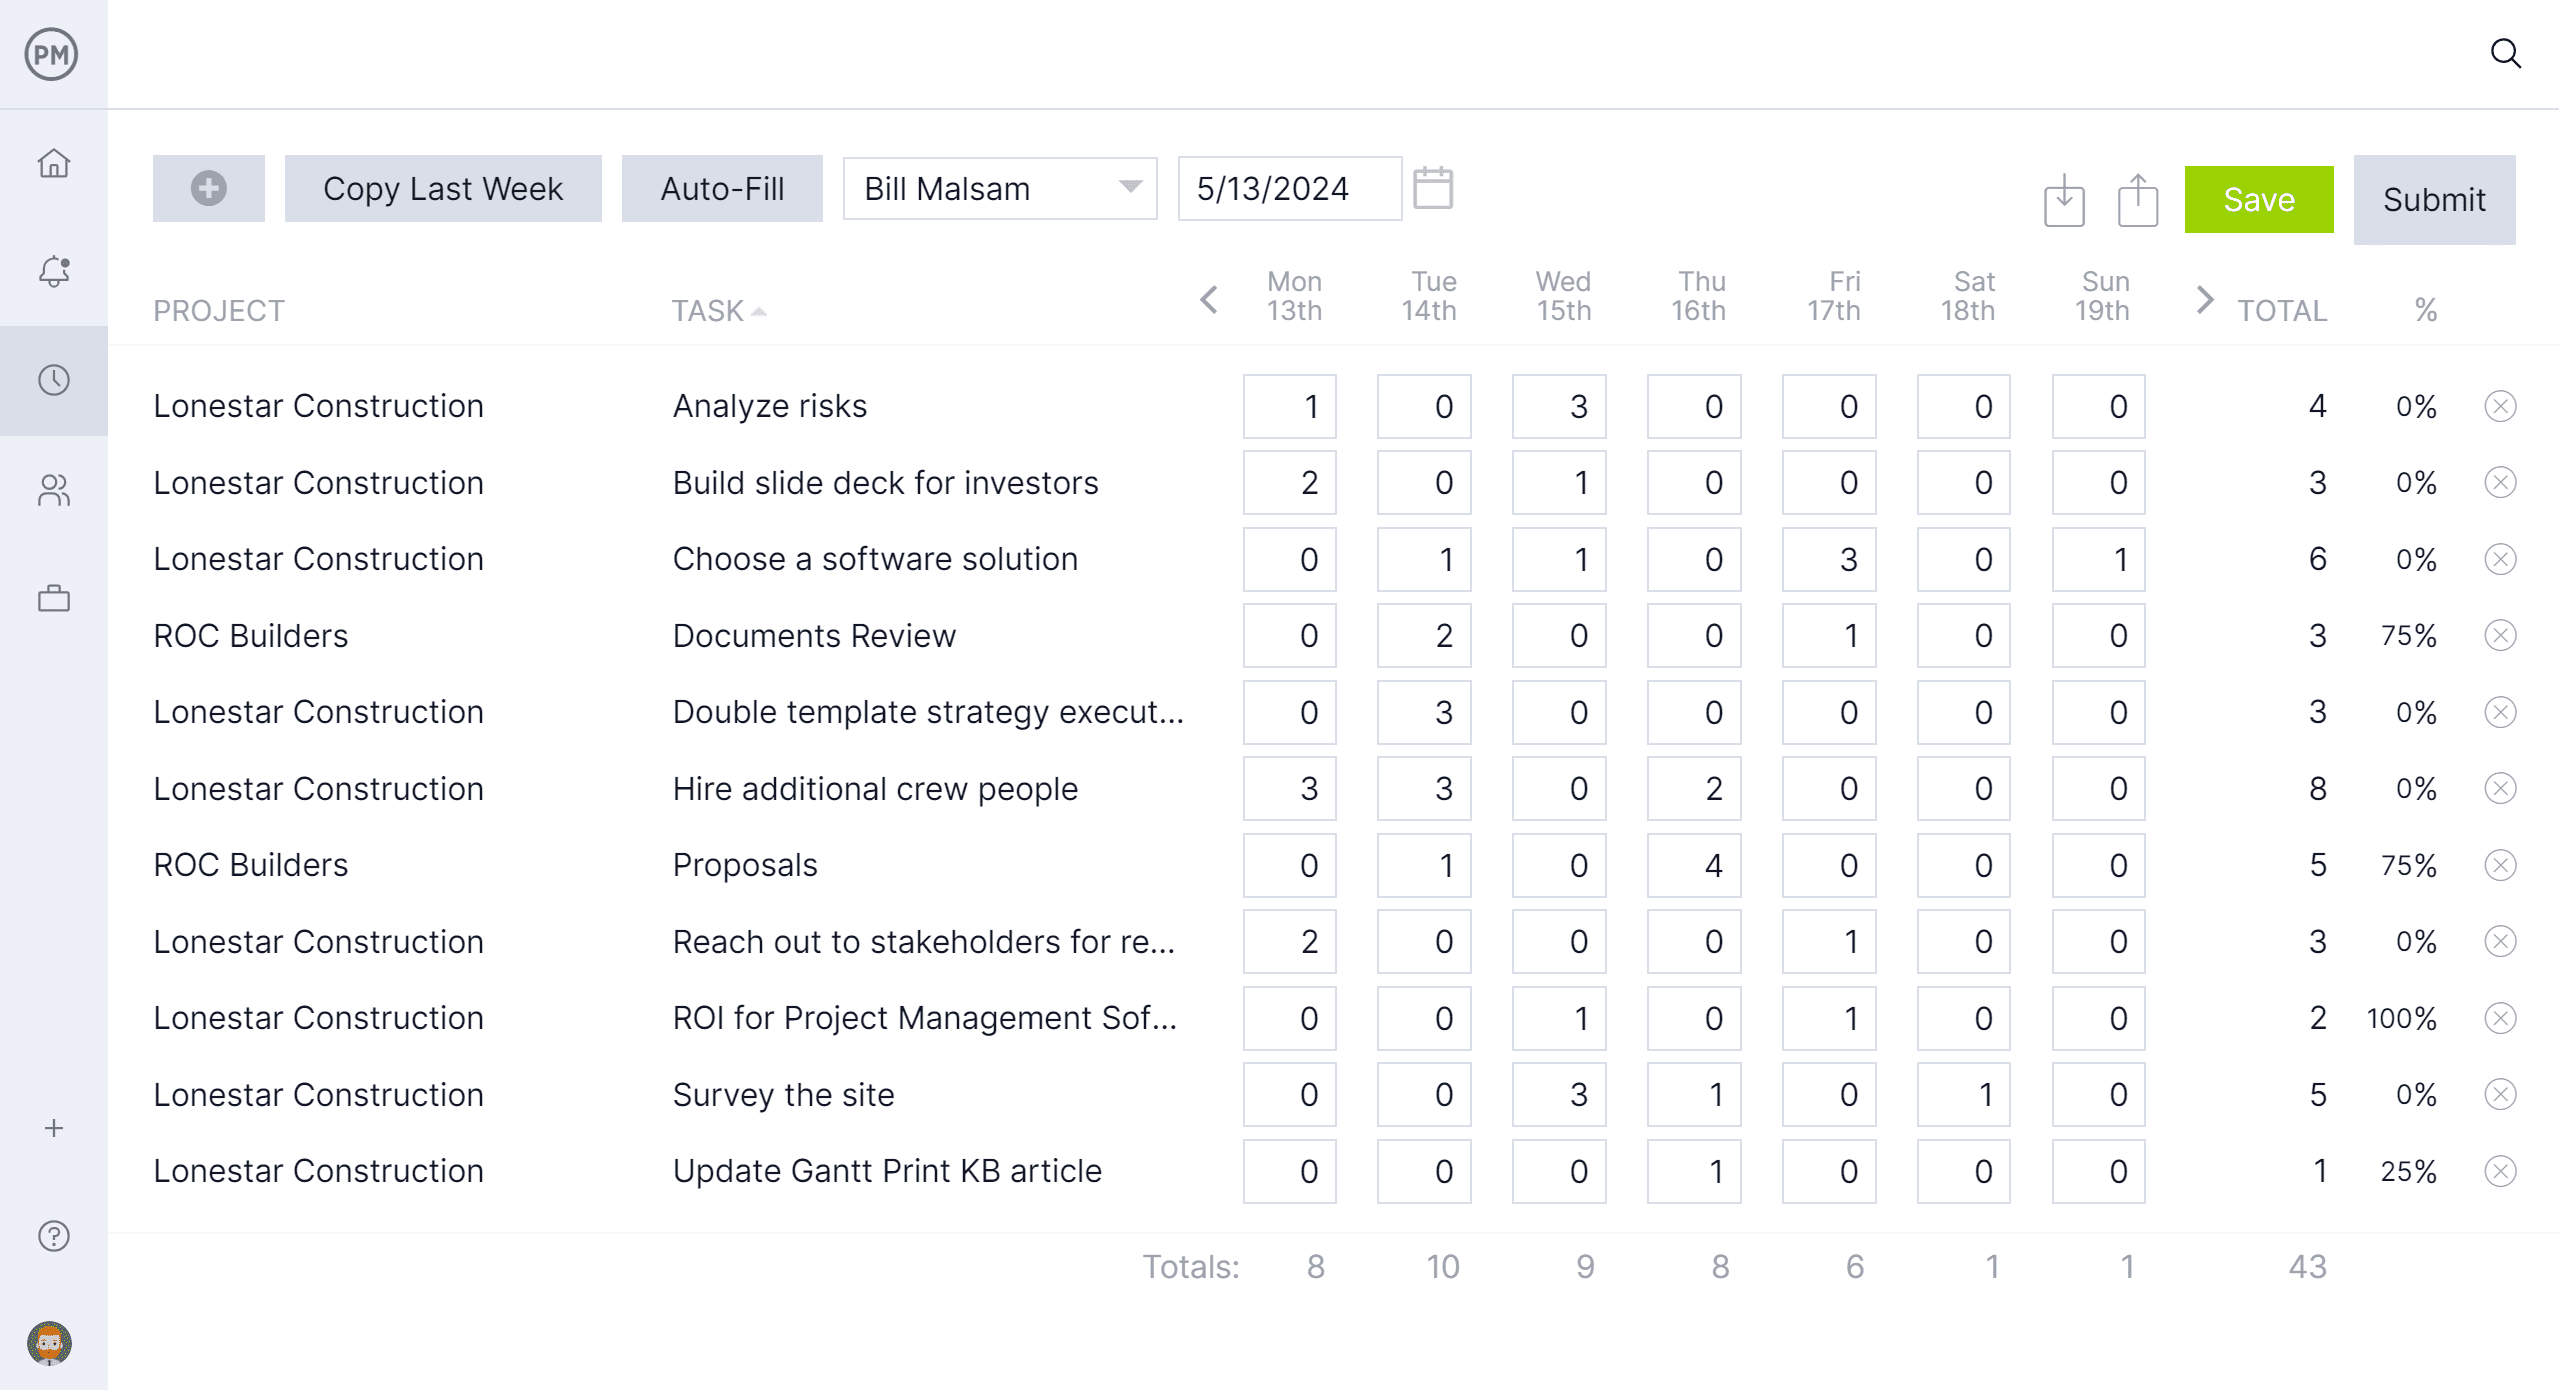
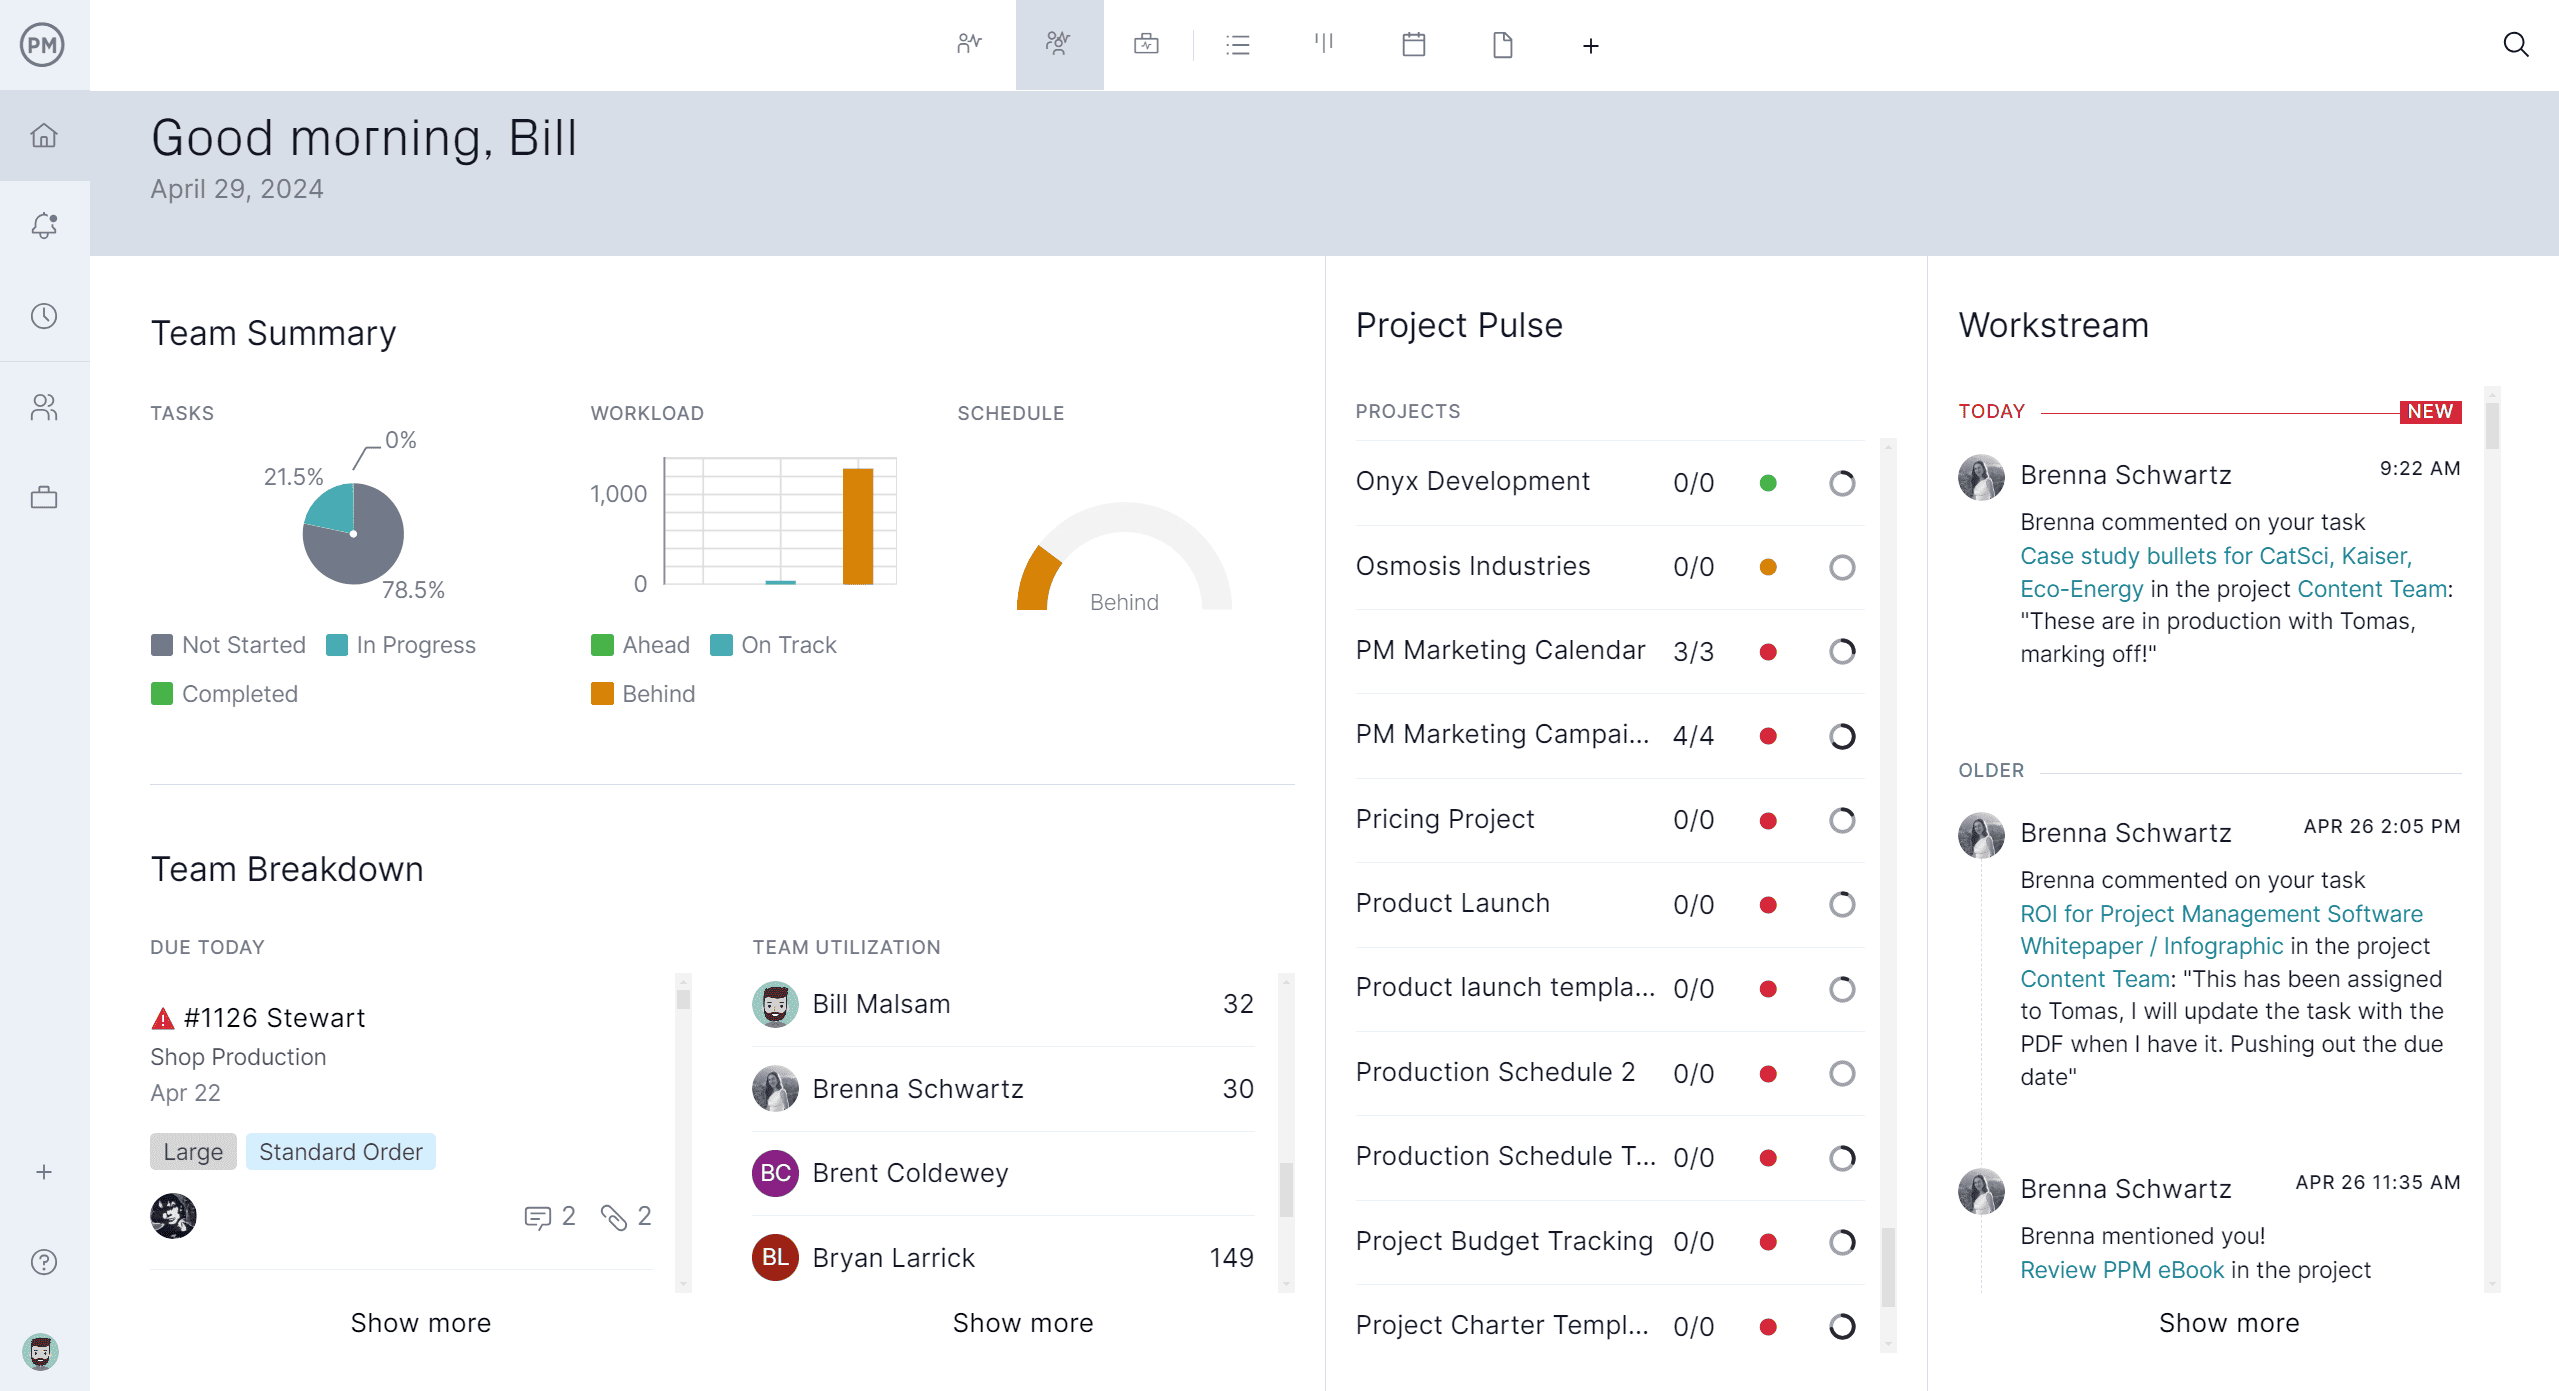
To keep work moving forward as planned requires regular monitoring of progress and more. Once the baseline is set on the Gantt chart, there are multiple ways to track project metrics. Project managers get a high-level overview of one or many projects with real-time project or portfolio dashboards. They automatically capture live data and display it on easy-to-read graphs and charts that show time, cost, workload and more. For more detail, customizable reports can be filtered to get into the weeds or summarize progress and share with stakeholders to keep them informed. Plus, secure timesheets do more than streamline payroll and provide data on how far team members are in completing their tasks, it also tracks labor costs to help keep projects on budget.
Manager Resources and Workloads
Process flow doesn’t help much in terms of the resources needed to execute what it’s mapping. Gantt charts can schedule both human and nonhuman resources, then managers can set team availability, including PTO, vacation and global holidays as well as skill sets, to help when making assignments. Color-coded workload charts show resource allocation so managers can quickly see who is overallocated or underutilized and balance the team’s workload to keep everyone working at capacity without risking burnout. There’s also a team page that provides a daily or weekly overview of the team, which can be filtered by progress, priority and more.
Related Process Management Content
Process flow is only a small part of the larger process management. For those who are curious and want to learn more, below are several links to recent articles about the subject.
ProjectManager is online project and portfolio management software that connects teams whether they’re in the office, out in the field or anywhere in the world. They can share files, comment at the task level and stay updated with email and in-app notifications. Join teams at Avis, Nestle and Siemens who use our software to deliver successful projects. Get started with ProjectManager today for free.


