


Manufacturers compete on speed, quality and reliability, which makes production monitoring a core discipline for keeping lines moving and customers happy. With the right practices, teams get instant visibility into throughput, downtime, scrap and labor so they can correct issues before small delays snowball into missed orders. Clear insight into what is happening on the floor helps leaders set realistic schedules, control costs and maintain consistent output across shifts and sites.
As operations scale, manual checks and siloed spreadsheets cannot keep pace with the volume of data or the speed of decision-making. Manufacturers need connected tools that turn raw signals into action. That is why forward-thinking plants elevate manufacturing monitoring from a clipboard exercise to a digital nerve center that informs planning, resourcing and continuous improvement.
What Is Production Monitoring?
Production monitoring is the ongoing practice of tracking the performance of your lines, workcells and teams to ensure targets are met and problems are resolved quickly. It brings together indicators like cycle time, changeover duration, scrap rates, first pass yield and unplanned downtime to show whether output is on track. When manufacturing monitoring is executed well, managers see a real-time picture of flow, constraints and resource use, then act with confidence to keep orders moving.
In day-to-day terms, production monitoring connects people, machines and schedules so decisions happen close to the work. Operators surface issues, supervisors rebalance tasks, planners adjust capacity and leadership reviews trends to guide investments. The value compounds when monitoring is continuous and standardized across lines, because insights from one area help prevent recurring issues in another.
Project management software centralizes schedules, tasks and resources in one system that mirrors how work actually happens. Instead of piecemeal logs, teams manage assignments, dependencies and approvals alongside live status updates. This alignment accelerates response times, improves handoffs between shifts and ensures every change is reflected across calendars, boards and reports without duplicate data entry.
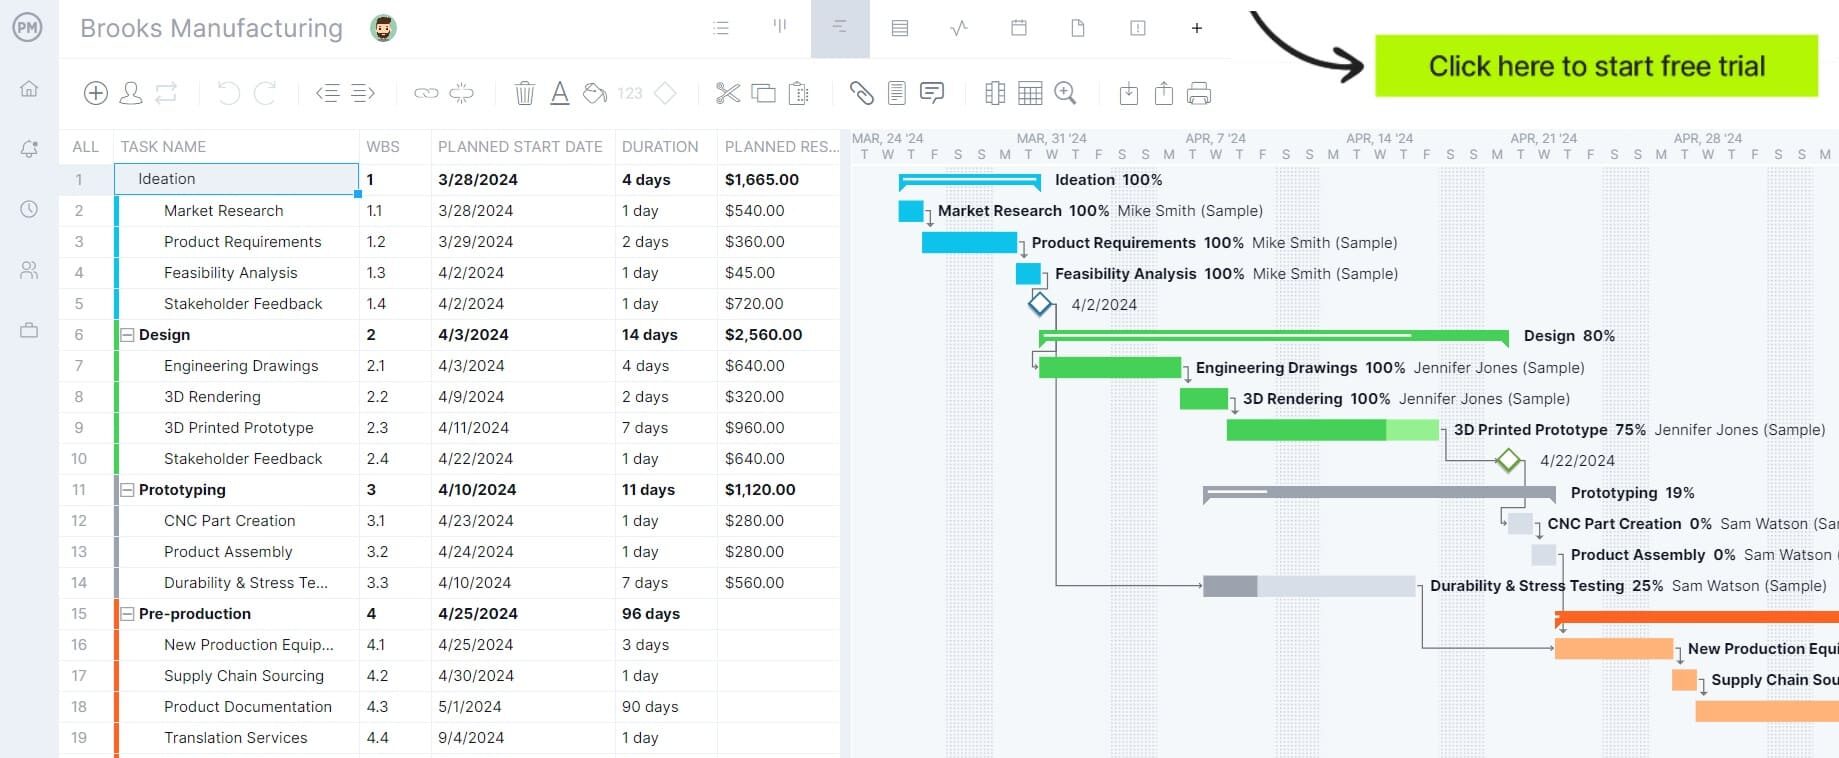
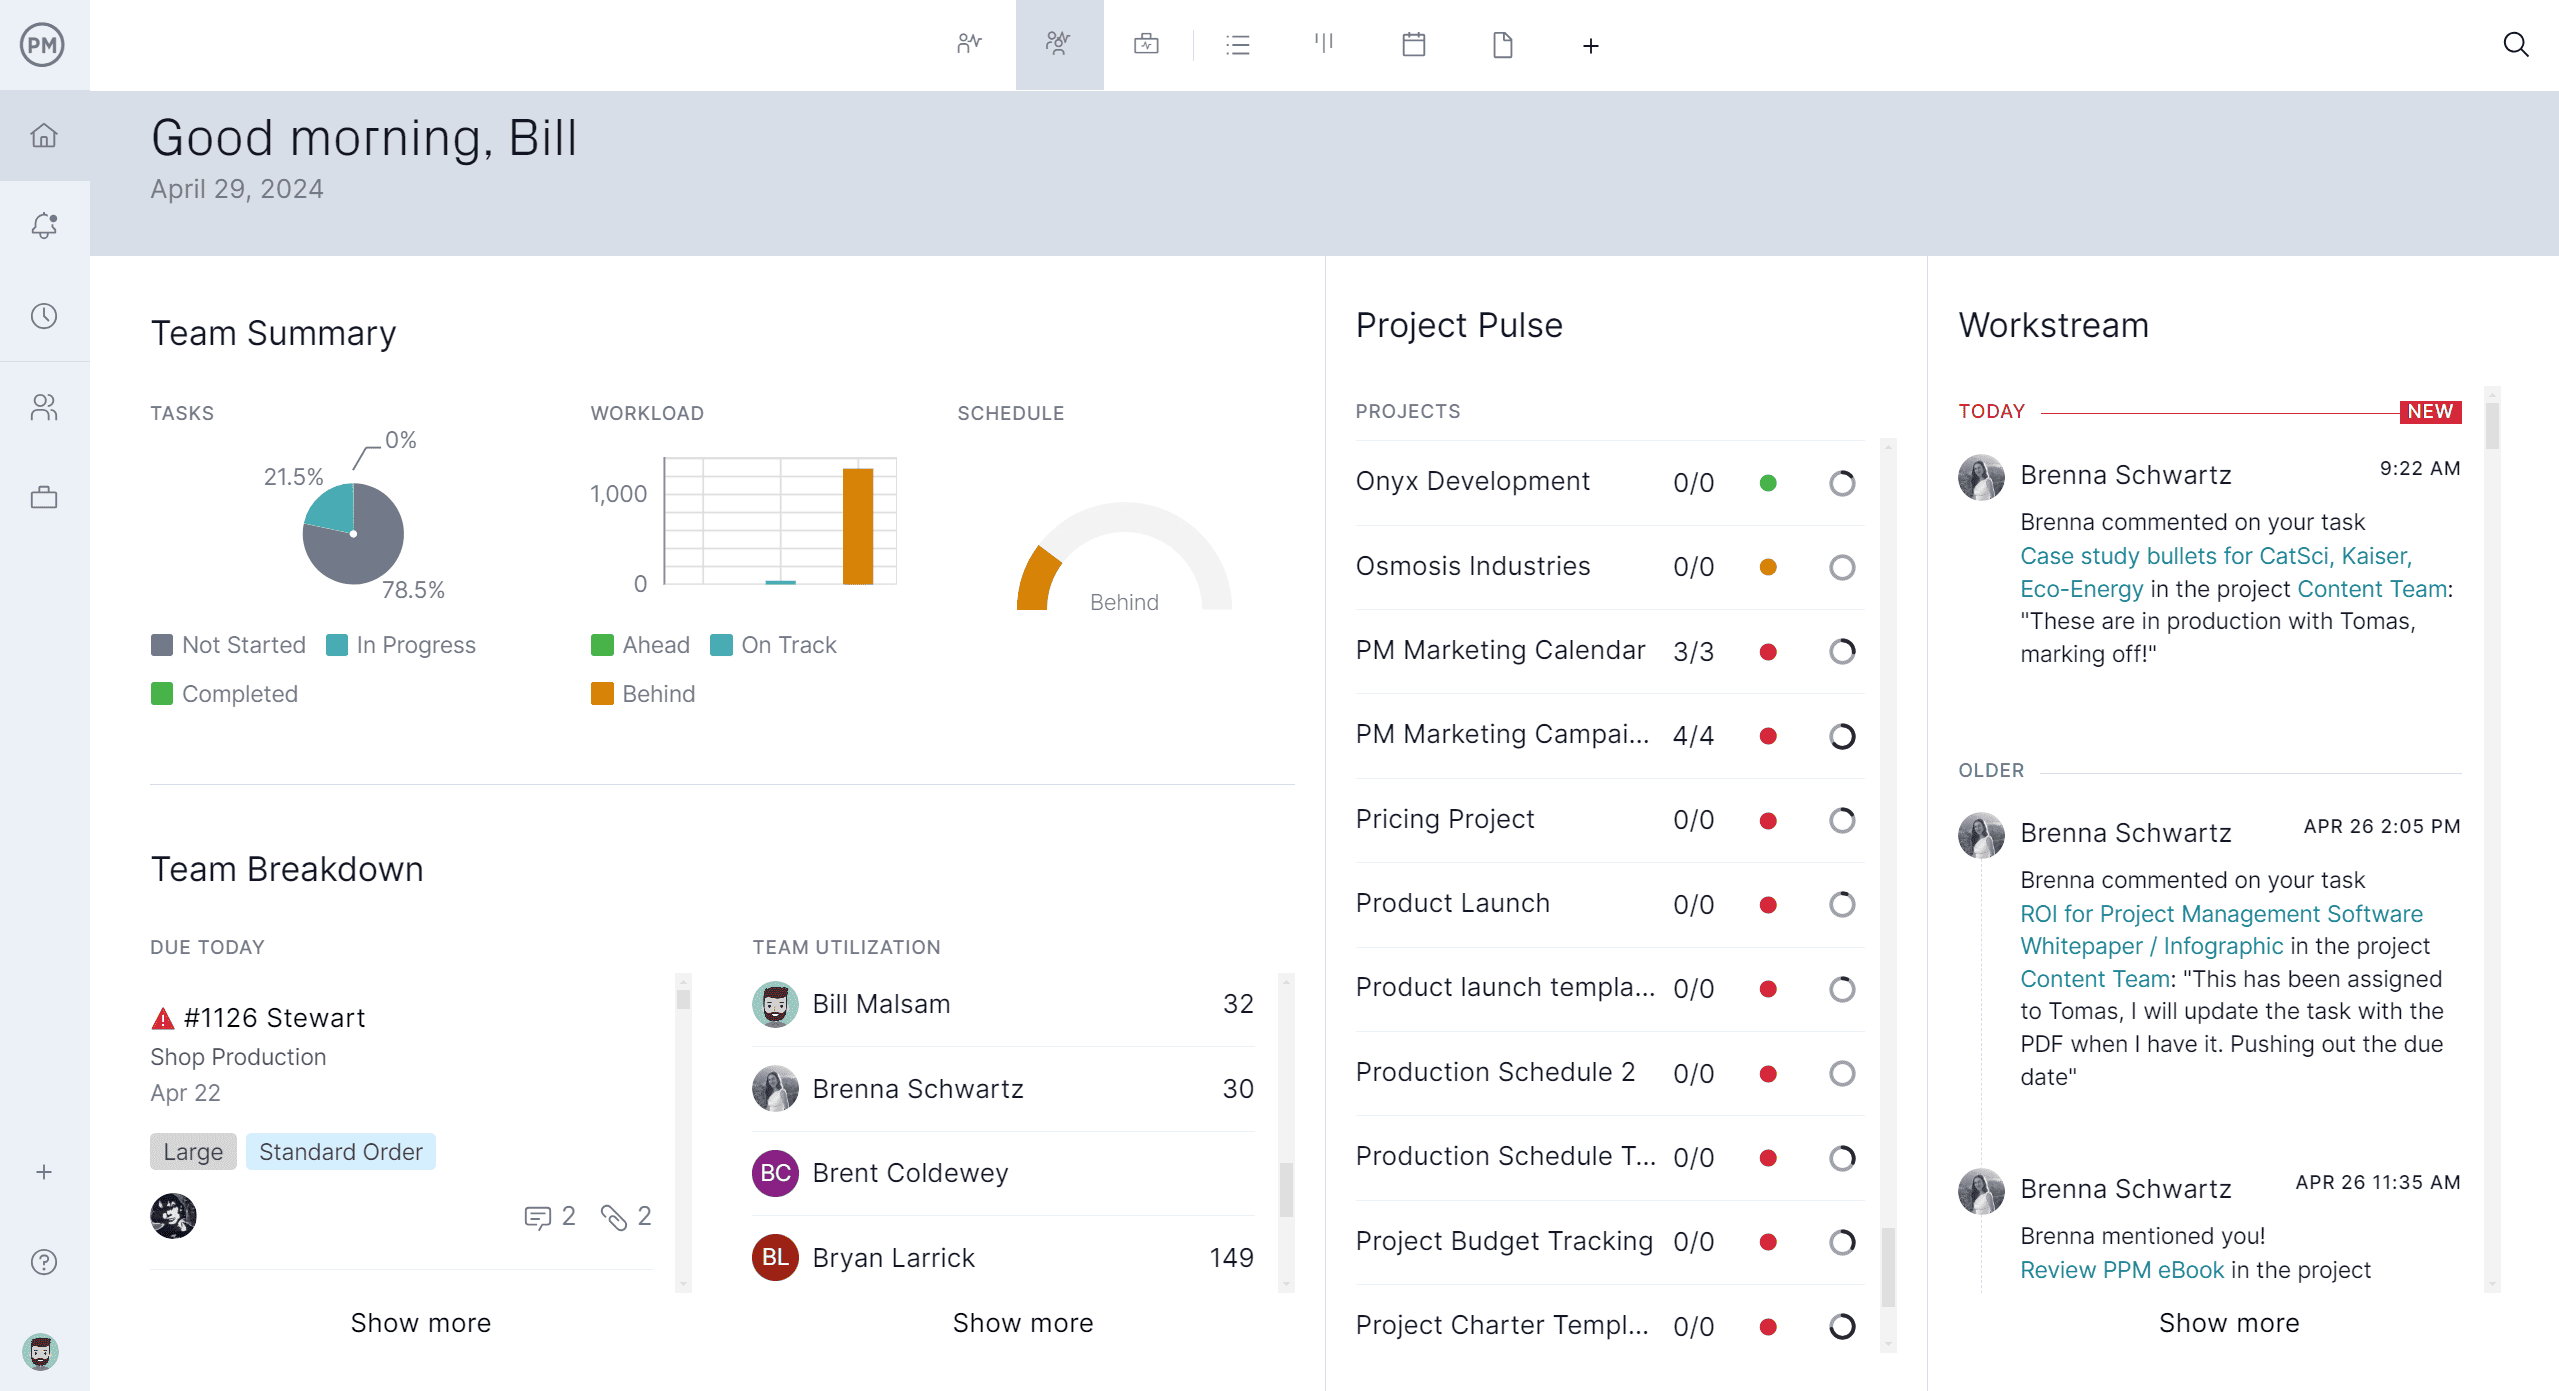
ProjectManager combines interactive Gantt charts, kanban boards, calendars and task lists with live dashboards that surface progress, workload and costs in real time. Managers can link task dependencies to protect the critical path, visualize bottlenecks on boards, rebalance capacity with workload charts and verify performance through customizable reports. This blend of planning power and live visibility makes our software a strong fit for plants that want to raise on-time delivery while reducing waste and rework. Get started with ProjectManager today for free.
What Is a Production Monitoring System?
A production monitoring system is the technology and process stack that captures operational data from people, machines and software, then presents it in timely, useful ways for action. On the data side, it may pull from operator inputs, machine counters, barcode scans or integrated ERPs.
On the action side, it turns those signals into dashboards, alerts and prioritized tasks, so supervisors can fix flow issues, planners can refine schedules and leaders can track goals against actuals. For manufacturing monitoring to deliver value, the system must be accurate, fast and embedded in daily routines, giving every role the information needed to keep output predictable and quality consistent.
What Are the Key Elements of a Production Monitoring System?
A production monitoring system is built on interconnected layers that work together to capture, process and act on manufacturing data. At the foundation, the hardware layer provides machines, sensors and infrastructure for real-time data collection. The software layer then integrates and processes this information, connecting production with enterprise systems.
The visualization and analytics layer transforms raw numbers into meaningful dashboards, reports and predictive insights. Finally, the human and process layer ensures people use this information effectively through defined workflows, responses and continuous improvement practices. Together, these layers enable efficiency, quality, and informed decision-making.
1. Hardware Layer (Data Capture & Infrastructure)
The hardware layer consists of the physical components that generate and transmit production data. This includes machines, programmable logic controllers (PLCs), and a wide range of sensors installed throughout the shop floor that measure cycle times, defects, energy use and environmental conditions.
IoT (Internet of Things) gateways and edge devices preprocess and transfer signals from the shop floor to higher systems. Networking infrastructure, such as industrial Ethernet, Wi-Fi or fieldbus, ensures reliable communication. Together, these elements provide the foundation for real-time production monitoring.
Machines & Controllers
- PLCs (Programmable Logic Controllers)
- CNC controllers, DCS (Distributed Control Systems)
Sensors
- Production flow: proximity switches, optical counters, RFID readers
- Quality: vision systems, barcode scanners, weight sensors, micrometers, cameras
- Condition monitoring: vibration, temperature, pressure, current sensors
- Environment: humidity, air quality, energy meters
IoT Gateways / Edge Devices
- Collect sensor/PLC data, buffer it, sometimes preprocess before sending upstream
Networking Infrastructure
- Industrial Ethernet, Wi-Fi, 5G, fieldbus (e.g., Modbus, Profibus), OPC-UA for interoperability
- Firewalls and secure switches for OT (Operational Technology) networks
2. Software Layer (Collection & Processing)
The software layer integrates, manages, and processes production data captured from hardware. SCADA systems and IoT middleware standardize input from PLCs and sensors, while manufacturing execution systems (MES) track orders, WIP, downtime and scrap. ERP systems connect production data with finance, inventory and supply chain.
CMMS tools manage maintenance activities using failure data. Databases or cloud platforms store time-series data for advanced analysis. This layer transforms raw signals into structured, contextualized information usable across production and enterprise systems.
Data Acquisition / Middleware
- SCADA (Supervisory Control and Data Acquisition) systems
- IoT/edge software for protocol translation (PLC → MQTT/HTTP, etc.)
MES (Manufacturing Execution System)
- Tracks production orders, batches, WIP, downtime, scrap, operators, machine states
- Provides schedule adherence, traceability, electronic batch records
ERP Integration
- Connects production data with finance, procurement, inventory and customer orders
CMMS (Computerized Maintenance Management System)
- Links equipment downtime/failure data to maintenance work orders and schedules
Databases / Data Lakes
- SQL/NoSQL/Time-series DB (e.g., InfluxDB) to store sensor and log data
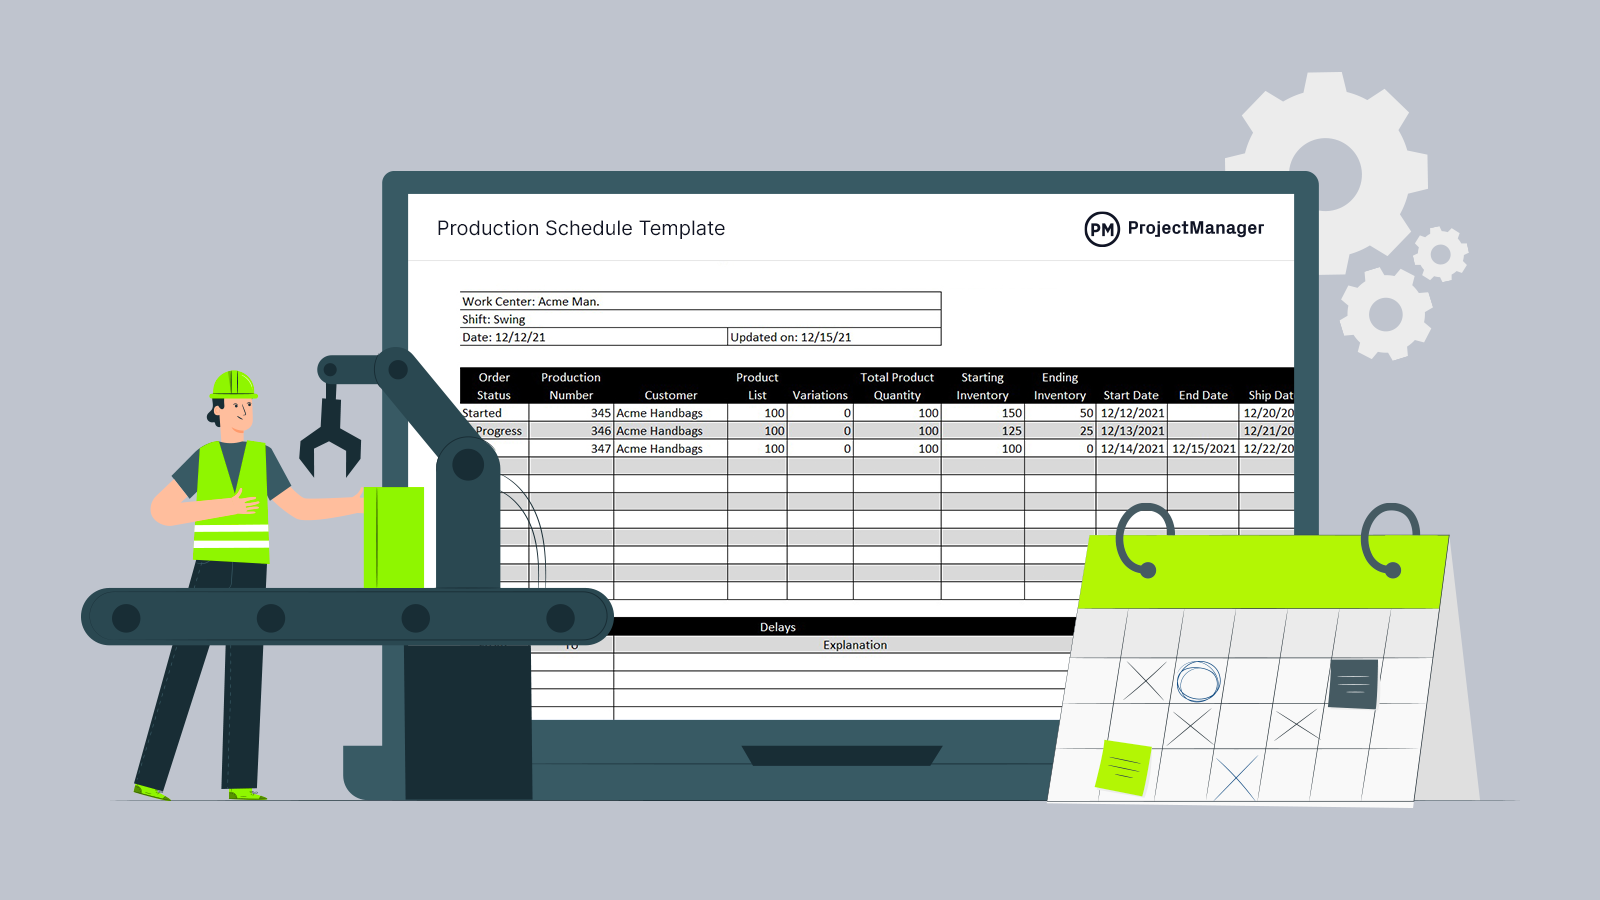
Get your free
Production Schedule Template
Use this free Production Schedule Template to manage your projects better.
3. Visualization & Analytics Layer
The visualization and analytics layer turns structured data into actionable insights. Dashboards, HMIs, and on-boards give operators and supervisors live visibility into KPIs like OEE, FPY, and downtime. Reporting tools summarize performance trends through Pareto charts, SPC or root-cause analysis. Predictive analytics forecast machine failures, quality risks, and scheduling conflicts using advanced algorithms. Alerts and notifications highlight exceptions in real time. This layer ensures stakeholders can quickly interpret production data, prioritize actions and drive continuous improvement initiatives.
Dashboards & HMIs
- Line-level: Andon boards, operator HMIs, live OEE displays
- Plant-level: Dashboards for supervisors, planners, quality managers
Analytics & Reporting
- KPI calculation (OEE, FPY, MTBF, scrap, cycle times)
- Pareto charts for downtime/defects
- Predictive analytics (machine learning for predictive maintenance, demand forecasting)
Alerts & Notifications
- Threshold-based triggers (SMS, email, push notifications, and on lights)
4. Human & Process Layer
The human and process layer ensures production monitoring systems create value through people and workflows. Operators record downtime reasons, defects, or corrective actions, while supervisors and managers review dashboards, escalate problems, and prioritize improvements. Standard operating procedures define how alerts are handled, who responds, and how issues are resolved. Training, safety practices, and communication routines further enhance reliability. This layer aligns people, processes, and decision-making with system insights, ensuring production data translates into efficiency, quality, and compliance.
- Operators (log downtime reasons, defects, corrective actions via terminals/tablets)
- Supervisors/Managers (review dashboards, prioritize improvements)
- Standard Workflows (who responds to alarms, who signs off on quality checks, escalation paths)
Related: 12 Best Production Scheduling Software for Manufacturing Projects in 2025
15 Key Production Monitoring Areas
Production monitoring focuses on tracking performance metrics that impact efficiency, quality and output. Each metric provides insights into different aspects of the manufacturing process, helping managers identify areas of improvement and ensure operations run smoothly. Below are 15 critical areas to monitor for optimal performance.
These metrics not only help detect issues early but also guide decision-making on production schedules, resource allocation and quality control. By understanding and measuring these areas, manufacturers can improve profitability, reduce downtime and ensure consistent product quality.
- Cycle Time: The total time it takes to complete one production cycle from start to finish.
- Takt Time: The rate at which products must be produced to meet customer demand.
- First-Pass Yield (FPY): The percentage of products that meet quality standards without rework or scrap.
- Scrap and Rework Rates: Measures how much production is lost due to defects or requires additional work.
- Process Capability (CP) & Process Capability Index (CPK): Indicates how well a process can produce within specified limits consistently.
- Overall Equipment Effectiveness (OEE): A comprehensive metric that measures equipment productivity across availability, performance and quality.
- Planned & Unplanned Downtime: Tracks both scheduled maintenance and unexpected production interruptions.
- Mean Time Between Failures (MTBF): The average time between equipment breakdowns, reflecting reliability.
- Mean Time to Repair (MTTR): The average time it takes to fix equipment and resume normal operations.
- Inventory Turnover: Indicates how often inventory is sold and replaced over a given period.
- OTIF: On-Time In-Full, a metric tracking whether orders are delivered as promised.
- Labor Productivity: Measures output per labor hour, reflecting workforce efficiency.
- Incidents and Near Misses: Tracks safety-related events to improve workplace safety and compliance.
- Schedule Adherence: Measures how closely production follows the planned schedule.
- Changeover Time: The time it takes to switch from producing one product to another.
Benefits of Production Monitoring
We’ve outlined only a handful of the benefits that production monitoring has to offer.
1. Improved Efficiency
Production monitoring ensures that every stage of the manufacturing process is tracked in real time. By analyzing performance metrics such as cycle time, OEE and downtime, managers can identify inefficiencies and optimize workflows. This leads to smoother operations, reduced waste and higher output.
2. Enhanced Quality Control
Consistent monitoring helps detect defects early and track first-pass yield, scrap rates and rework. This minimizes quality issues, reduces costs associated with defective products and maintains customer satisfaction through reliable production standards.
3. Better Resource Utilization
By monitoring machine performance, labor productivity and material usage, manufacturers can allocate resources more effectively. This prevents overuse or underutilization of equipment and staff, lowering costs while maintaining high productivity levels.
4. Increased Equipment Reliability
Tracking MTBF and MTTR metrics supports proactive maintenance, reducing unplanned downtime and extending the lifespan of machinery. Predictive analytics can also anticipate failures before they occur, allowing teams to act before production is impacted.
5. Data-Driven Decision-Making
Production monitoring provides actionable insights through dashboards, reports and trend analyses. Managers can make informed decisions quickly, improving schedule adherence and overall profitability.
How to Manage Production Projects With ProjectManager
Managing production projects effectively requires visibility across multiple workflows, tasks and deadlines. ProjectManager provides several project views to suit different management styles and operational needs. Gantt charts offer a detailed timeline of tasks and dependencies, helping managers visualize the critical path and schedule resources efficiently.
Kanban boards give teams a dynamic way to track progress and move tasks through production stages, while calendar views help plan and balance workloads across shifts. Task lists allow managers to assign, prioritize and check off activities, ensuring no steps are overlooked. All views update in real time, so everyone stays on the same page and production progress is transparent across teams.
Optimize Resource Management
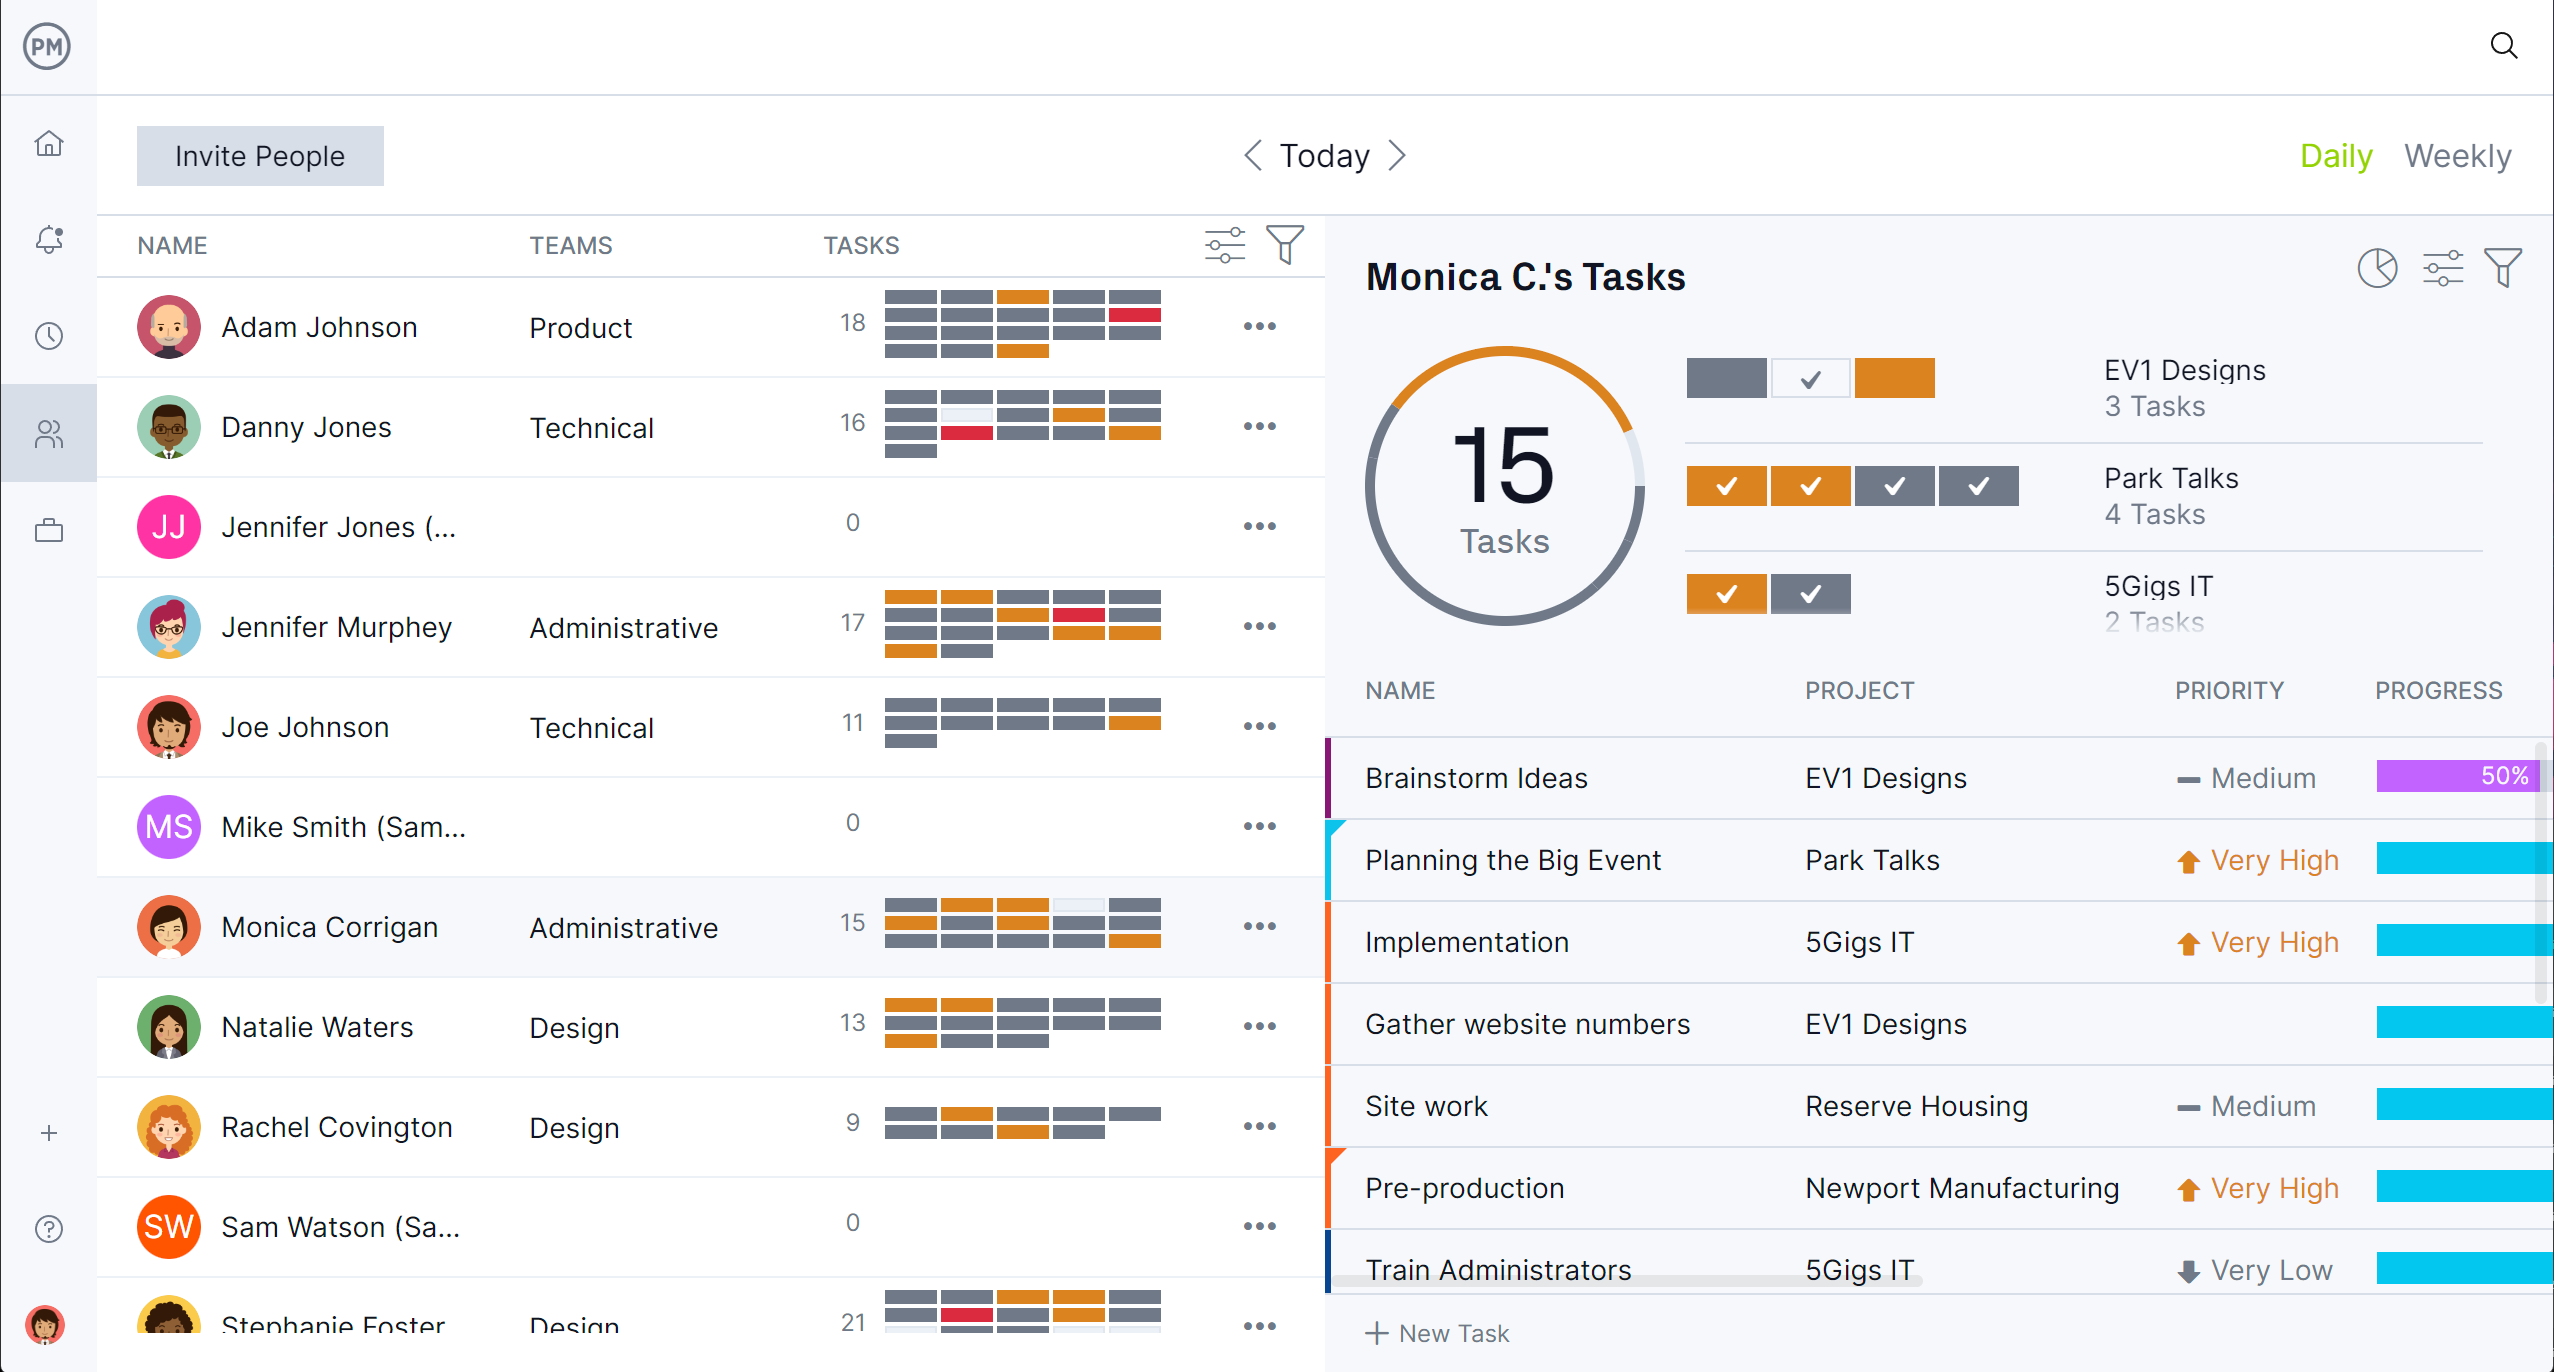
ProjectManager’s resource management tools allow managers to allocate people, machinery and materials efficiently. Workload charts display who is working on what and highlight any overassigned staff or idle resources, making it easy to rebalance tasks before bottlenecks occur.
Managers can set priorities, adjust schedules and reassign resources with a simple drag-and-drop interface. Equipment and material usage can also be tracked, ensuring critical machinery is utilized fully and production costs remain controlled. These tools empower production managers to prevent downtime, reduce bottlenecks and maximize output across all projects.
Track Progress in Real Time
Keeping projects on schedule requires constant monitoring of task completion, milestones and dependencies. ProjectManager provides live dashboards and customizable reports that show overall project health, task status, budget usage and resource allocation. Notifications alert managers to delays or completed tasks, allowing them to respond immediately.
Time tracking ensures labor hours are recorded accurately, while reporting features provide insight into cost performance and productivity trends. By combining visual tools with real-time updates, ProjectManager gives production teams the ability to anticipate problems, make informed decisions and maintain steady progress toward project goals.
Related Production Planning Content
There’s more to production than production monitoring. For those interested in expanding their knowledge, we have many articles on production planning. Below are some links to recent articles on making a production plan, best production scheduling software and more.
ProjectManager is online project and portfolio management software that connects teams, whether they’re in the office or out in the field. They can share files, comment at the task level and stay updated with email and in-app notifications. Join teams at Avis, Nestle and Siemens who are using our software to deliver successful projects. Get started with ProjectManager today for free.


