


Several project scheduling techniques help teams plan and track their work effectively. Among them is the program evaluation and review technique, also known as PERT. This method uses a diagram to visualize tasks, their dependencies and estimated durations. Originally developed for large, complex projects, PERT has become a reliable way to organize work, manage timelines and reduce uncertainty by accounting for different scenarios in project completion. Below, we explore what program evaluation and review technique is, its origins and its evolution.
What Is the Program Evaluation and Review Technique?
The program evaluation and review technique is a project scheduling method that uses a network diagram to represent tasks and their sequence. Each task is assigned three time estimates—optimistic, pessimistic and most likely—to account for uncertainty.
By calculating expected durations based on these estimates, teams can identify the critical path and forecast project timelines more accurately. PERT helps managers visualize dependencies, manage risks and plan resources efficiently, making it a valuable tool for complex or time-sensitive projects.
The program evaluation and review technique influences the creation of a Gantt chart by helping project managers identify task durations, dependencies and the critical path. It emphasizes estimating optimistic, pessimistic and most likely timeframes for each activity, which allows for more accurate scheduling. This approach ensures the Gantt chart reflects a realistic timeline and highlights the sequence of tasks that directly impact project completion. Integrating program evaluation and review technique data into a Gantt chart helps visualize how time estimates affect the overall project flow and enables better planning for potential delays.
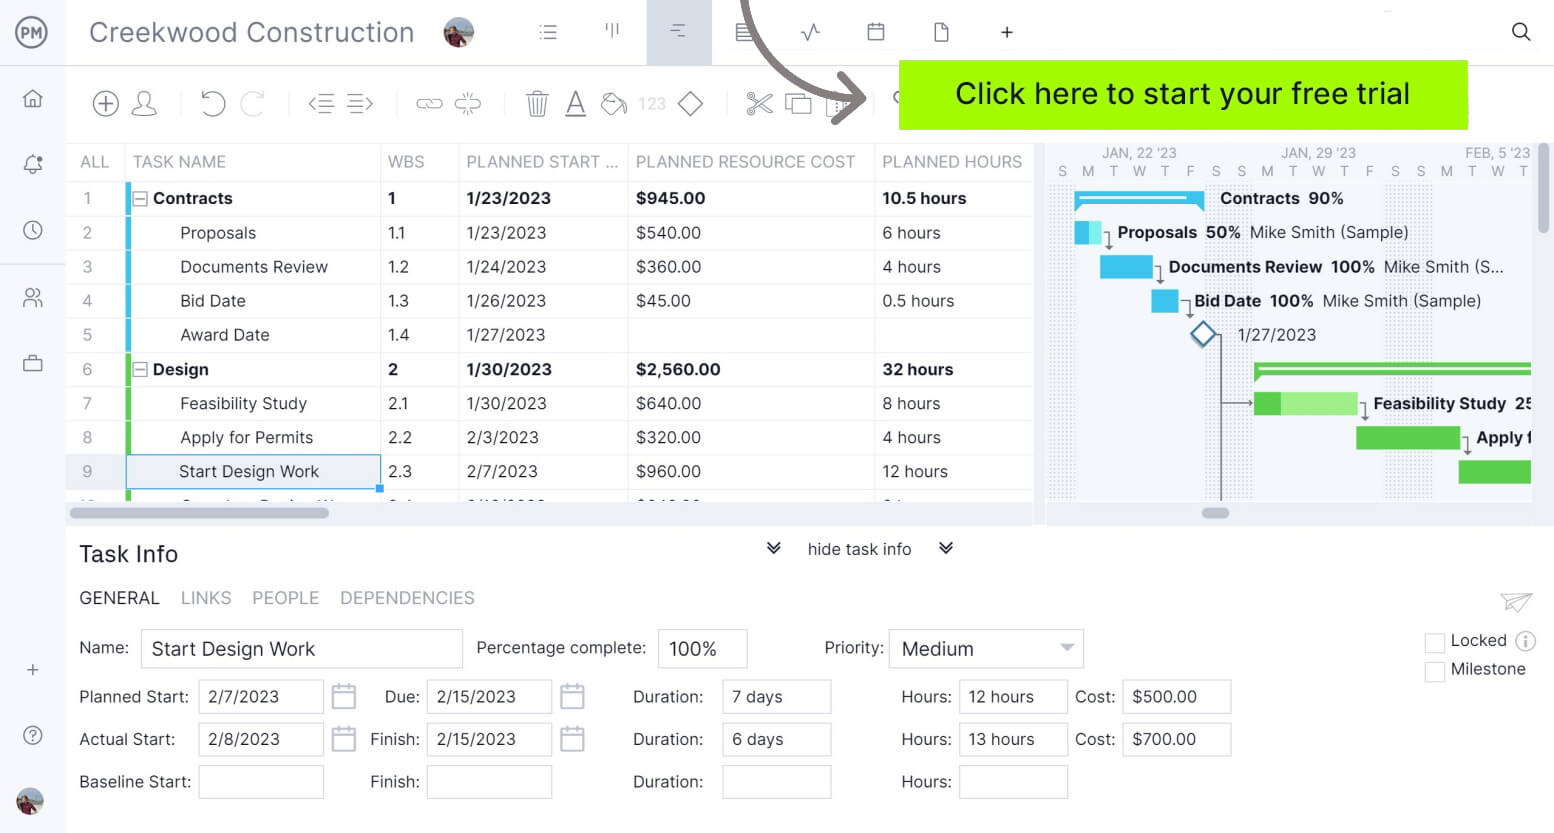
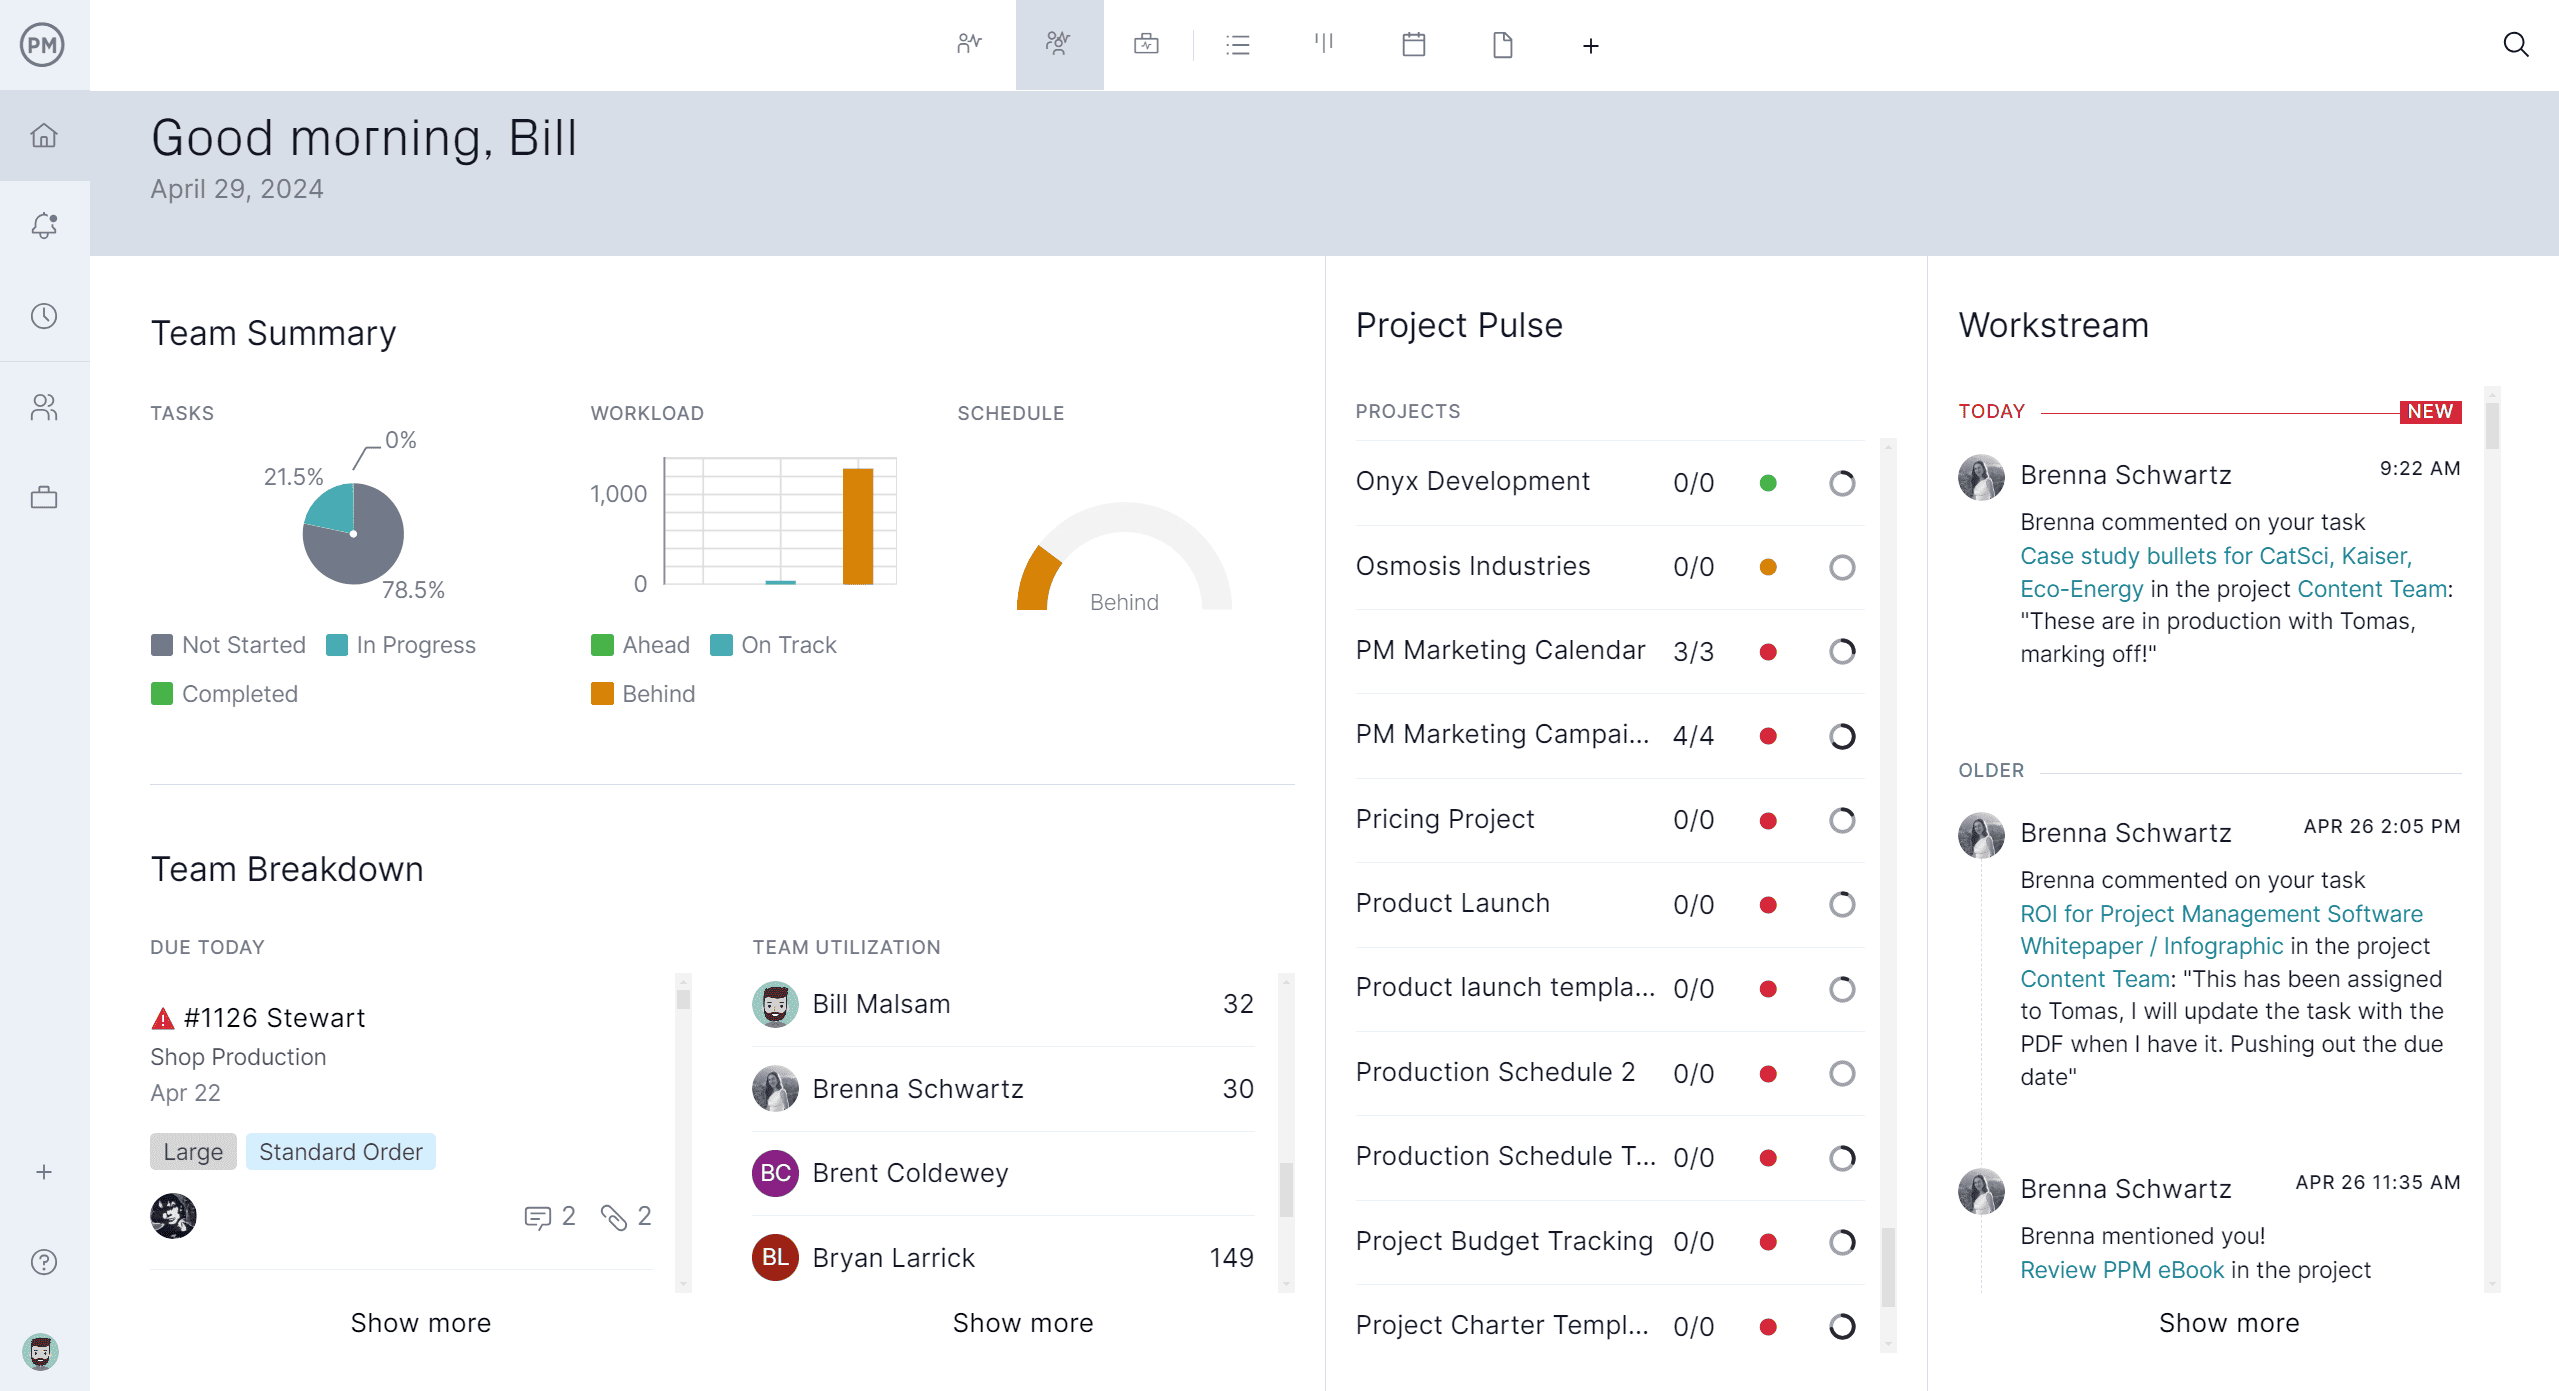
ProjectManager is award-winning project and portfolio management software with robust Gantt charts that streamlines this process by allowing users to link all four types of task dependencies—finish-to-start, start-to-start, finish-to-finish and start-to-finish—ensuring precise sequencing of work.
Users can filter for the critical path to instantly see which tasks determine the project’s duration and require close monitoring. Setting a baseline lets teams compare planned timelines against actual progress in real time, making it easier to catch deviations early. With these features, our software enhances how program evaluation and review technique-informed schedules are visualized and adjusted throughout the project lifecycle. Get started with ProjectManager today for free.
When Was the Program Evaluation and Review Technique Invented?
The U.S. Navy invented the program evaluation and review technique in the late 1950s for the Polaris missile program that addressed the need to manage large, complex projects under tight deadlines. Over time, its utility expanded beyond defense into industries like construction, software development and manufacturing.
As project management matured, PERT evolved to integrate with other tools and methodologies, enabling its use in diverse scenarios. Today, it remains relevant for projects where estimating timelines and managing uncertainty are critical to success.
What Is a Program Evaluation and Review Technique Diagram?
A PERT diagram is a visual representation of a project’s tasks and their dependencies, used to plan and manage schedules. It displays tasks as nodes connected by arrows that indicate the sequence and relationships between them. Each task includes time estimates—optimistic, pessimistic and most likely—to account for uncertainty.
By mapping out the project, a program evaluation and review technique diagram helps identify the critical path, forecast completion dates and allocate resources effectively. It’s especially useful for large, complex projects where timing is uncertain and dependencies are numerous.
What Are the Components of a PERT Diagram?
A PERT diagram consists of several key components that work together to illustrate a project’s structure and flow. Understanding these components is essential to creating, reading and analyzing a PERT diagram effectively. Below are the main components and their definitions.
Nodes
Nodes represent the individual tasks or milestones within a PERT diagram. Each node includes information about the task, such as its name, estimated durations and sometimes early or late start and finish times. Nodes are the building blocks that define the work to be completed.
Arrows
Arrows show the relationships and dependencies between tasks in a PERT diagram. They connect nodes and indicate the direction of workflow from one task to the next. Arrows clarify which tasks depend on the completion of others and help visualize task sequences.
Task Sequences
Task sequences describe the specific order in which tasks must be carried out in a PERT diagram. The dependencies among tasks determine the task sequence and define the path a project will follow from start to finish. Task sequences ensure tasks are completed logically and efficiently.
Task Dependencies
Task dependencies define how tasks in a PERT diagram rely on each other. They indicate which tasks must be completed before others can begin. Understanding dependencies helps identify the sequence of activities and highlights which tasks are critical for project progress.
Task Duration Estimates
Task duration estimates in a PERT diagram include three values for each task: optimistic, pessimistic and most likely. These estimates account for uncertainty in how long a task might take, allowing managers to calculate expected durations and plan schedules under variable conditions.
Task Duration Estimates Variance
Task duration estimates variance measures the degree of uncertainty in a task’s estimated duration. By calculating the variance between the pessimistic, optimistic and most likely estimates, project managers can assess risk levels and make informed decisions about timelines and resource allocation.
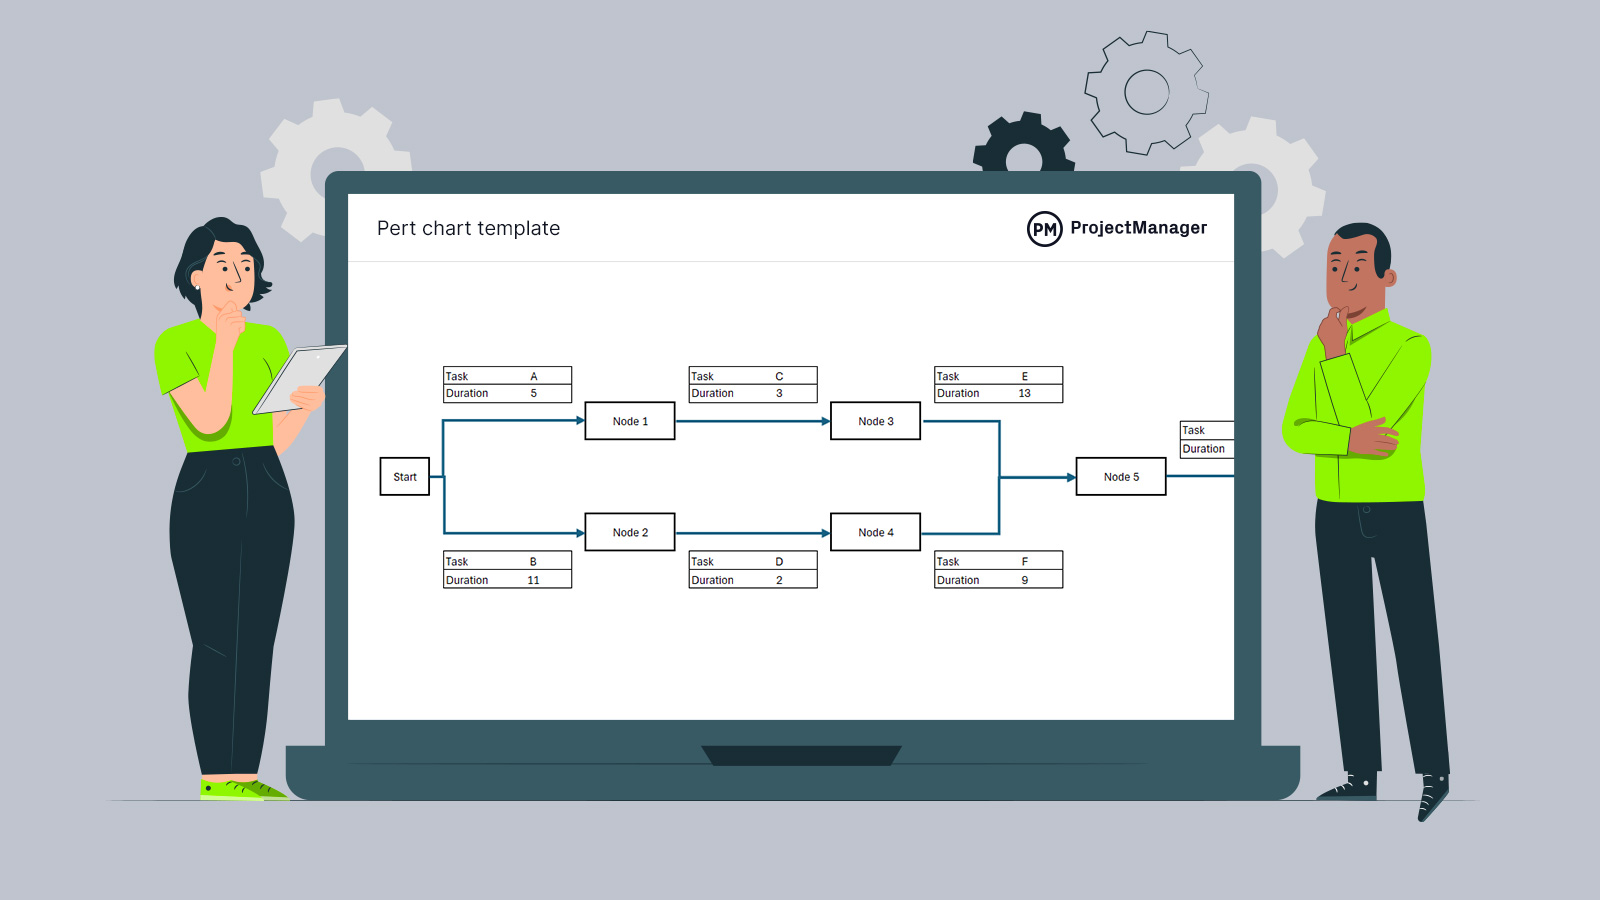
Program Evaluation and Review Technique Diagram Template
Download our free program evaluation and review technique template for Excel. A PERT diagram template for Excel helps you organize and visualize projects efficiently. It includes a table for listing tasks, their dependencies and the three time estimates—optimistic, pessimistic and most likely—along with variance.
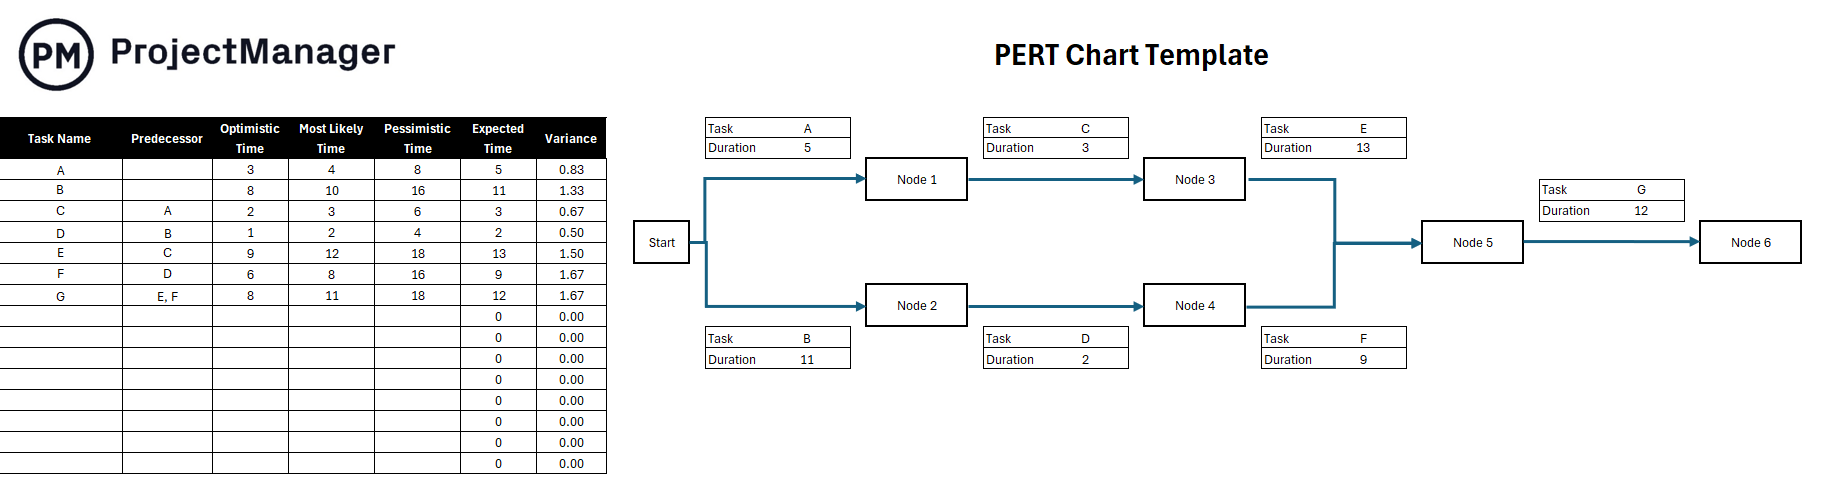
The template also features a network diagram created with nodes and arrows to illustrate task sequences. Built-in formulas calculate the most likely task duration and variance automatically, making it easier to estimate timelines, identify the critical path and manage project uncertainty effectively.
When to Use the Program Evaluation and Review Technique
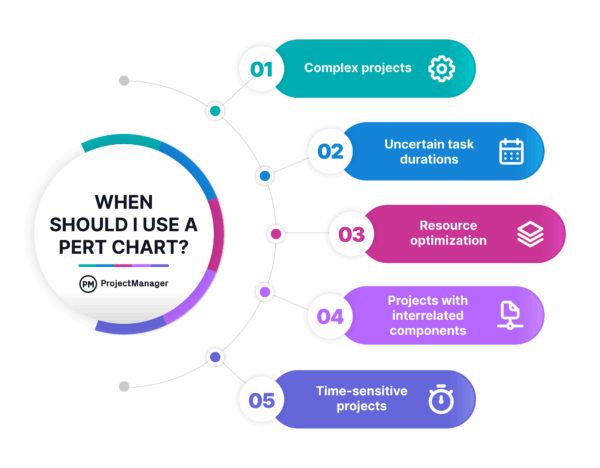
The program evaluation and review technique is best for complex projects with many interdependent tasks and uncertain timelines. It’s ideal when you need to account for variability in task durations and visualize dependencies. PERT works well in industries like construction, defense, software development and research where predicting timelines is challenging. When a project involves tight deadlines, significant risk or many stakeholders, PERT helps plan schedules realistically and identify the critical path to keep everything on track.
How to Use the Program Evaluation and Review Technique
Using the program evaluation and review technique involves several steps that guide you from planning to creating a clear project schedule. Below we outline the first step in this process.
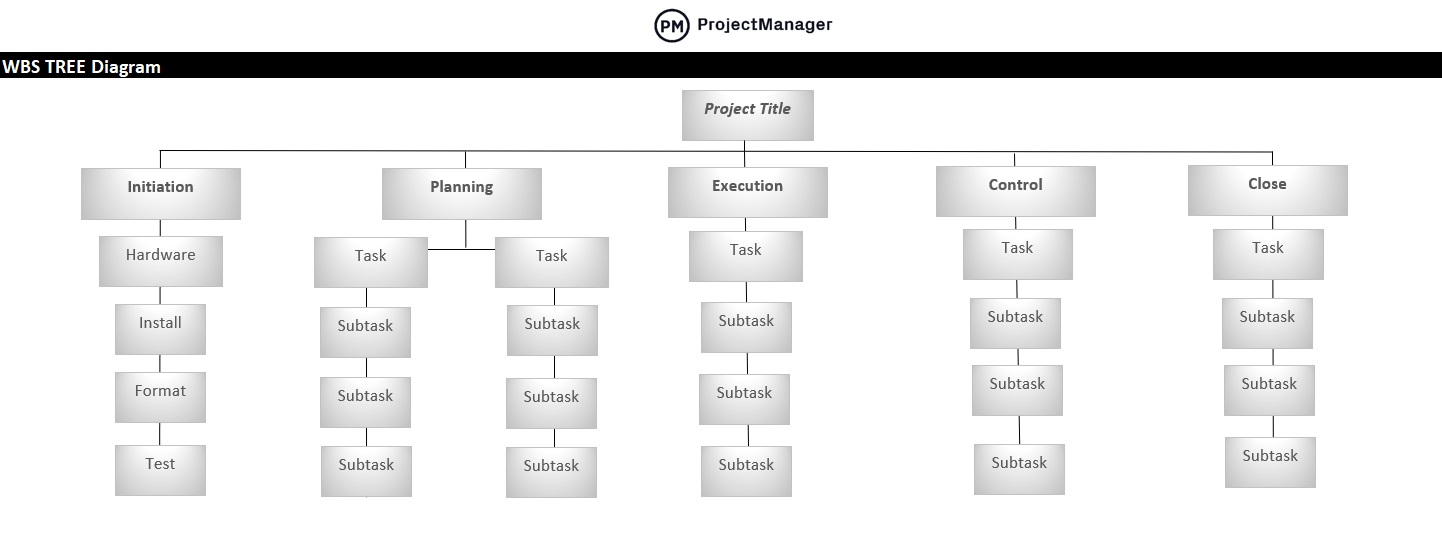
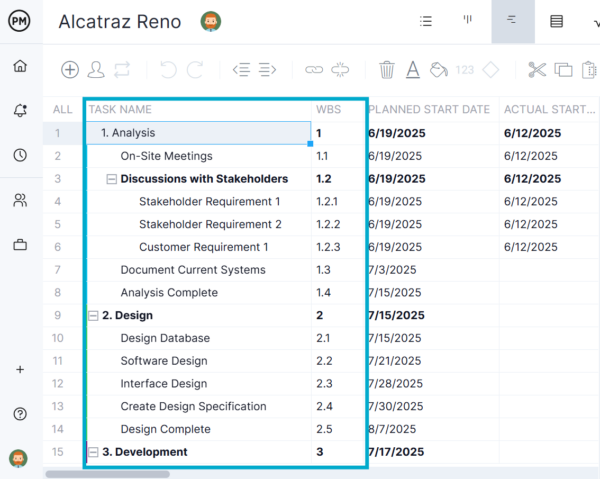
1. Define the Scope of the Project with a WBS
Before making a PERT diagram, define the project scope by creating a work breakdown structure (WBS). A WBS organizes the project into smaller, manageable components, ensuring nothing is overlooked. It identifies all deliverables, milestones and tasks required for completion.
With a WBS, you can pinpoint dependencies, assign time estimates and lay out tasks accurately on your PERT diagram. Starting with a WBS ensures your PERT diagram reflects the full scope of work effectively and minimizes the risk of missing key elements.
2. Create a Project Task List
After defining the scope with a WBS, the next step is to create a detailed project task list. This involves identifying every task required to execute the project and produce the agreed deliverables. Breaking down the project into specific tasks ensures nothing is overlooked and helps clarify dependencies between activities. The task list serves as the foundation for the PERT diagram, as each task becomes a node with estimated durations and dependencies, making it easier to visualize and manage the entire project schedule.
3. Make 3 Estimates for the Duration of Tasks
Once all project tasks are identified, the next step is to estimate their durations using three values: optimistic, pessimistic and most likely.
The optimistic estimate assumes everything goes perfectly, the pessimistic accounts for worst-case scenarios and the most likely reflects normal conditions.
- O = Optimistic Estimate
- M = Most Likely Estimate
- P = Pessimistic Estimate
The expected task duration is calculated with the formula:
Expected Task Duration: (O + 4 * M + P) / 6
To assess variability, the variance is calculated as:
Variance: ((P – O) / 6) ^ 2
These estimates help account for uncertainty and improve schedule accuracy in the PERT diagram.
4. Identify Task Dependencies
The next step is to identify task dependencies, which determine how tasks relate to and rely on each other. Recognizing these dependencies allows you to establish the correct task sequences necessary for project execution.
Understanding which tasks must happen before others ensures your PERT diagram accurately reflects the logical flow of work. Identifying dependencies at this stage prevents scheduling conflicts and helps you create a clear, realistic project plan that highlights the critical path and minimizes potential delays.
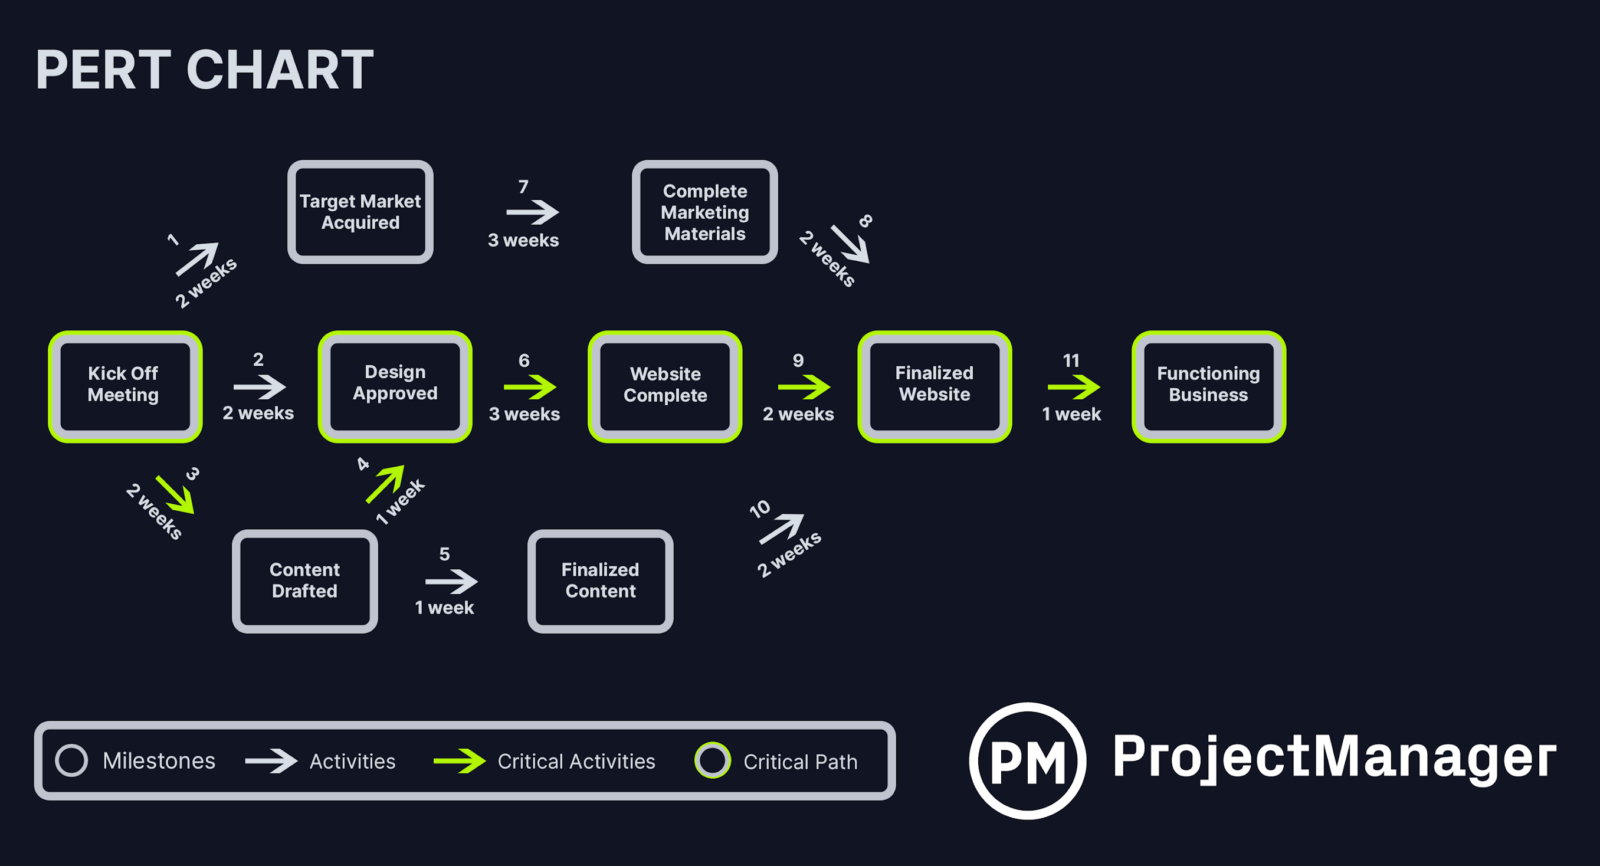
5. Draw a PERT Diagram
With task sequences and dependencies defined, the next step is to draw the PERT diagram. Start by mapping each task as a node and connecting them with arrows based on the identified dependencies. Incorporate the expected task durations calculated earlier into the diagram for each task.
This visual representation helps you see the overall project flow, identify the critical path and communicate the project schedule effectively. A well-drawn PERT diagram ensures clarity and improves your ability to manage project timelines successfully.
6. Estimate the Project Timeline
After drawing the PERT diagram, the next step is to estimate the total project timeline. This is done by adding up the expected durations of the tasks along the identified sequences. By summing these durations, you can determine how long the project is likely to take under normal conditions.
This estimate helps set realistic deadlines, allocate resources effectively and anticipate potential delays, giving stakeholders a clear understanding of when the project is expected to be completed.
7. Identify the Critical Path
The final step is to identify the project’s critical path. This involves determining which sequence of tasks has the longest total expected duration in the PERT diagram. The critical path represents the minimum time required to complete the project.
Any delays in these tasks will directly impact the overall timeline. Recognizing the critical path allows managers to focus attention on these crucial tasks, ensuring they stay on track and minimizing risks to the project’s schedule.
Get your free
PERT Chart Template
Use this free PERT Chart Template to manage your projects better.
Benefits of the Program Evaluation and Review Technique for Project Scheduling
The program evaluation and review technique offers several advantages for planning and scheduling projects, especially those with uncertainty and complex dependencies. Below are eight key benefits that make PERT a valuable tool for effective project management and improved timeline accuracy.
- Accounts for uncertainty with three time estimates per task
- Helps visualize task dependencies and project flow clearly
- Identifies the critical path to focus on key tasks
- Improves resource allocation by clarifying task sequences
- Supports better decision-making under uncertain conditions
- Minimizes scheduling conflicts through clear dependencies
- Facilitates communication among team members and stakeholders
- Enhances ability to predict and mitigate potential project delays
ProjectManager Is Better Than a PERT Diagram
ProjectManager offers more flexibility and functionality than a traditional program evaluation and review technique diagram by giving users multiple project views to plan and manage work effectively. While a PERT diagram is limited to showing task sequences and durations, our software includes Gantt charts, task lists, kanban boards and calendars to provide a full picture of the project.
The Gantt chart stands out for visualizing timelines, setting dependencies and tracking progress against a baseline, while task lists and kanban boards help teams manage daily work more efficiently. The calendar view offers a time-based layout for scheduling and deadlines, making it easier to stay organized. With these views, users can move between strategic planning and task-level execution seamlessly, something a program evaluation and review technique diagram alone can’t support.
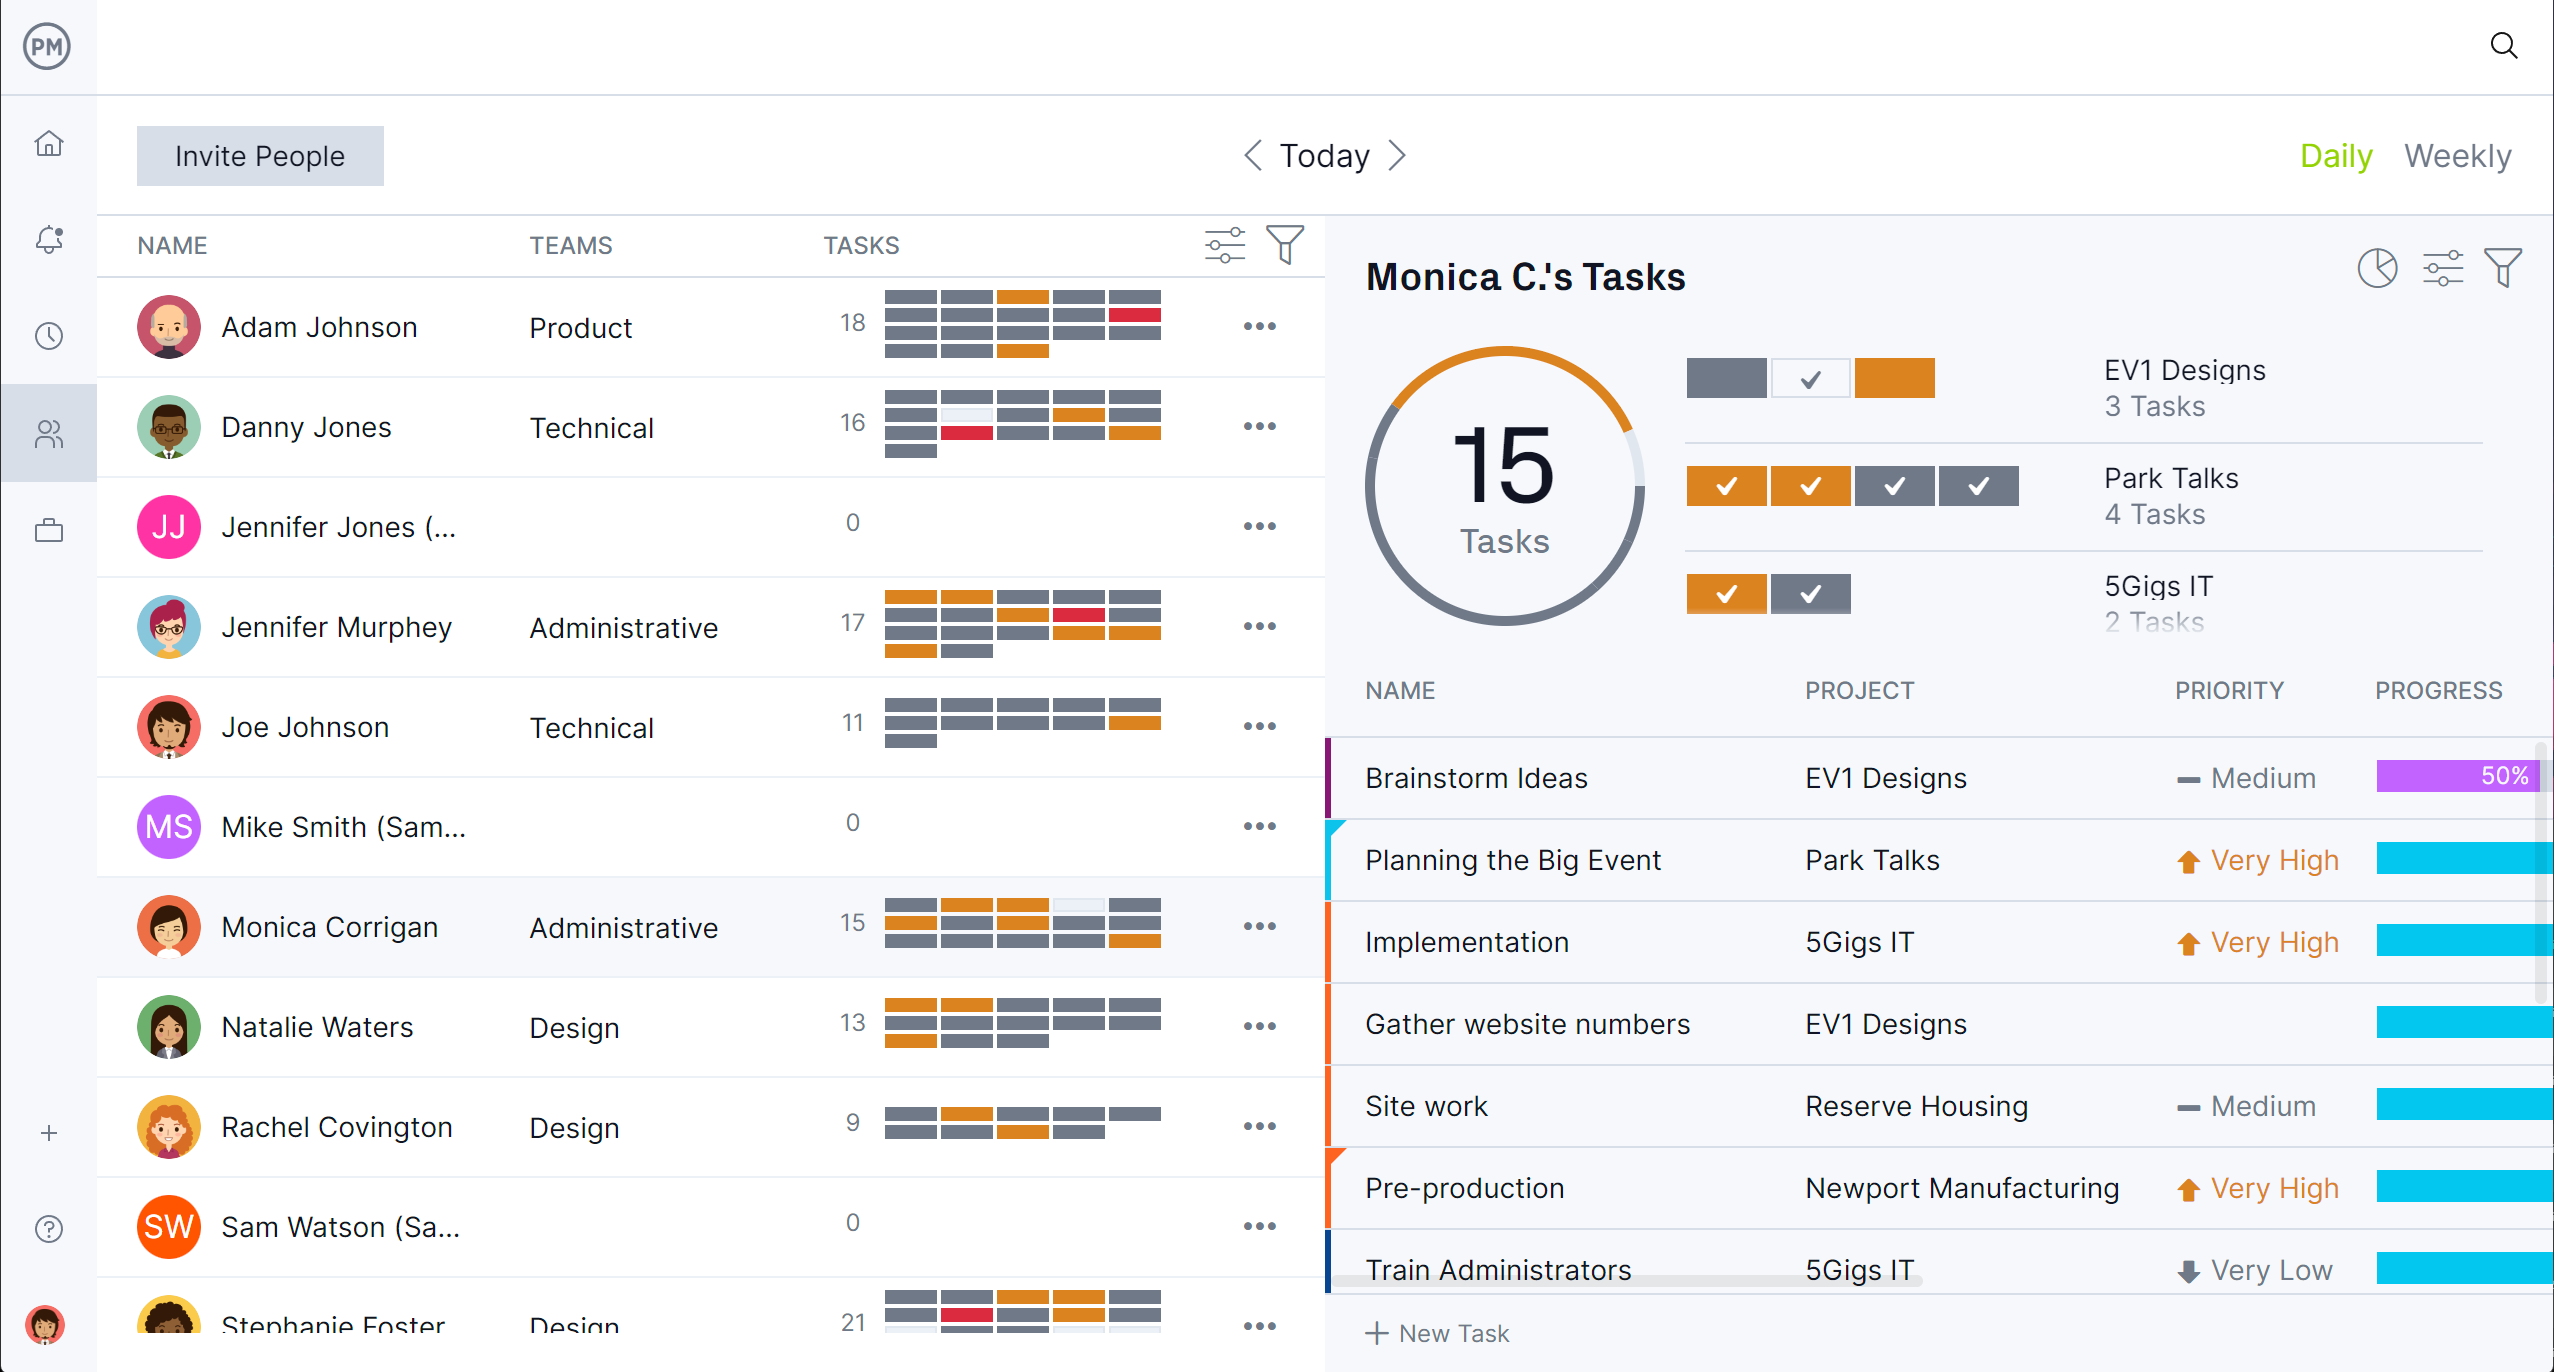
Support Teams and Materials With Resource Management Features
Further improving on what program evaluation and review diagrams lack is our integrated and powerful resource management tools that support the people doing the work and the nonhuman resources they need to execute that work. The availability feature makes it easy to assign tasks to team members who can take them on, avoiding overload and idle time.
The workload chart uses color-coding to show who is over- or under-assigned at a glance, helping you maintain balance across your team. The team page acts as a hub where you can see every member’s assignments and availability in one place, ensuring that the right resources are aligned with the right tasks throughout the project.
Get Real-Time Visibility Into Project Cost, Resources and More
Real-time tracking tools offer a level of visibility and control far beyond what program evaluation review technique diagrams can provide. Live project and portfolio dashboards instantly display progress, cost, workload and timelines across multiple projects, allowing you to spot issues and make adjustments quickly.
Customizable reports let you generate detailed updates for stakeholders or internal reviews without extra manual work. Secure timesheets feed actual effort data into the system, enabling accurate tracking and more informed decisions. Together, these features ensure you not only plan effectively but also stay on target as the project unfolds.
Content Related to the Program Evaluation and Review Technique
For those who want to learn more about the program evaluation and review technique, follow the links below. They take readers to blog posts that go deep into what a PERT chart is, how it differs from critical path method and other tools and techniques for project managers.
ProjectManager is online project and portfolio management software that connects teams whether they’re in the office or out in the field. They can share files, comment at the task level and stay updated with email and in-app notifications. Join teams at Avis, Nestle and Siemens who use our software to deliver successful projects. Get started with ProjectManager today for free.


