


Ethereum is currently trapped between strong higher-timeframe support and heavy resistance left behind by the recent breakdown.
Bulls must defend the $3.9K base to keep the broader uptrend intact, while reclaiming the $4.2K resistance band would provide confirmation for a continuation move toward the previous highs.
By Shayan
The Daily Chart
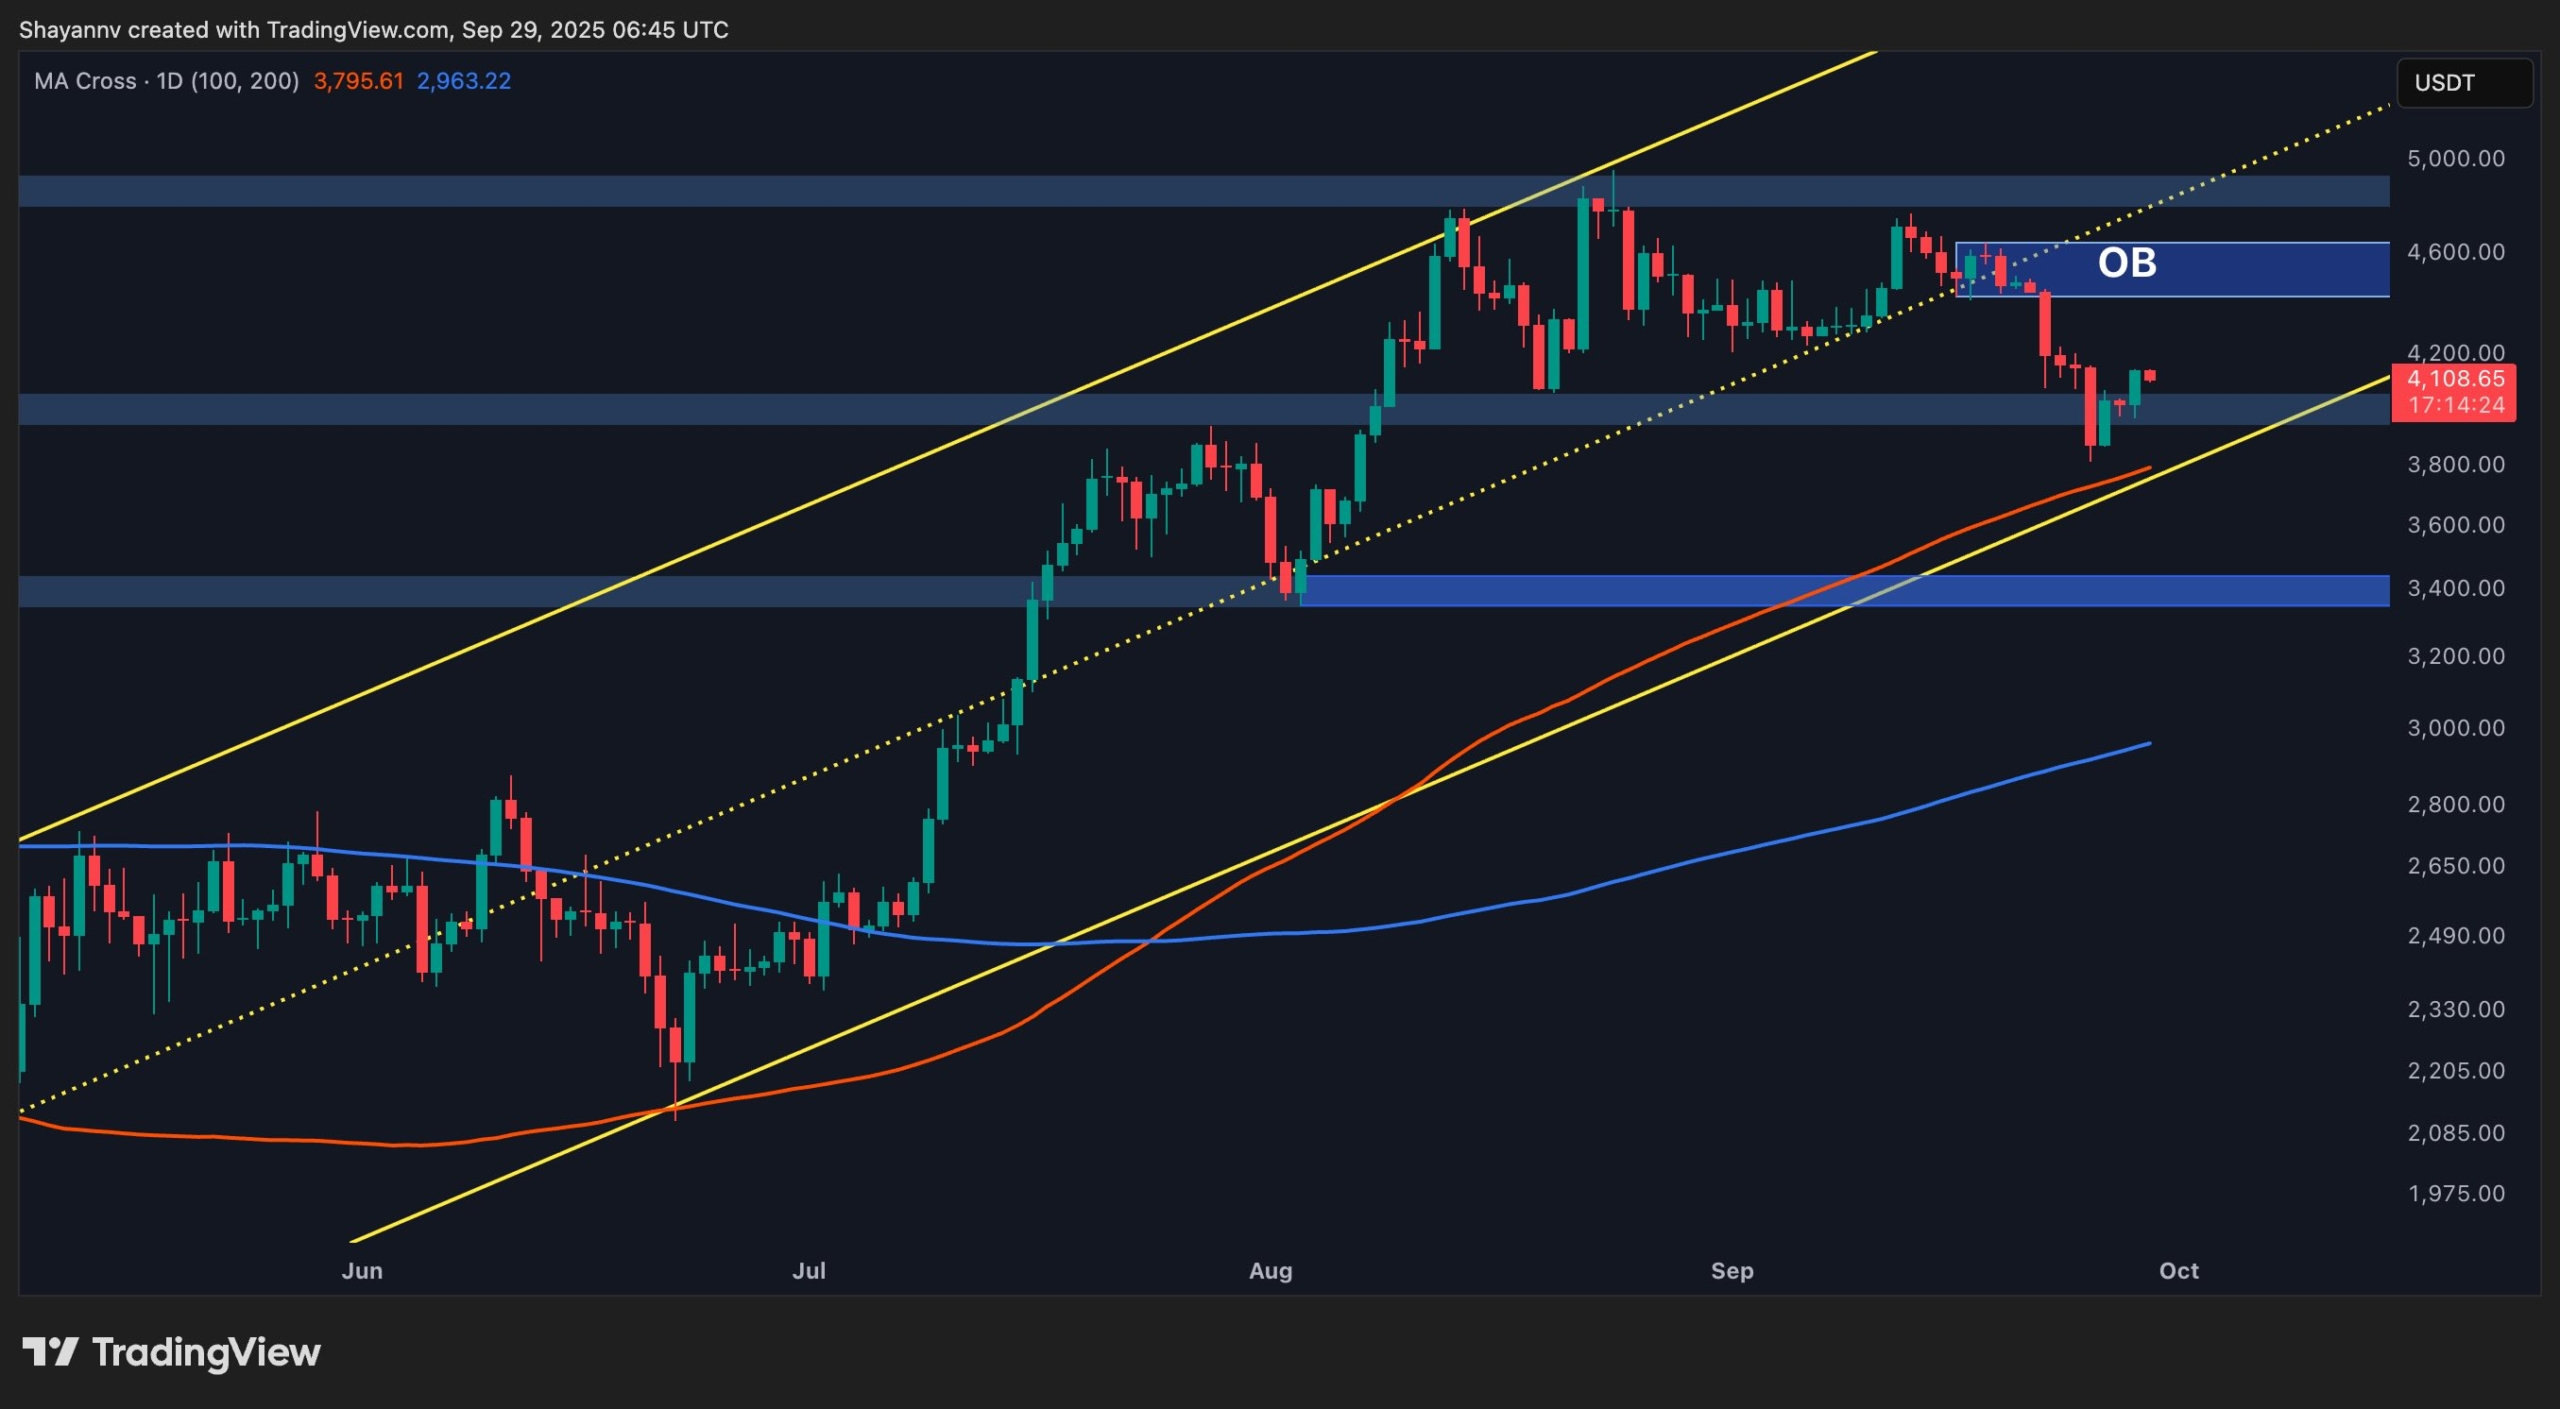
On the daily timeframe, ETH has pulled back from its recent peak into a critical support confluence, including the 100-day moving average and the ascending channel’s lower boundary around $3.8K. Despite the recent sell-off, the cryptocurrency remains above the 200-day moving average, which continues to serve as a longer-term bullish anchor.
The rejection from the order block near $4,600–$4,700 has left the market vulnerable to short-term downside pressure. However, as long as the price holds above $3.8K–$3.9K, there remains scope for recovery. A sustained daily close back above the order block would likely trigger renewed bullish momentum.
The 4-Hour Chart
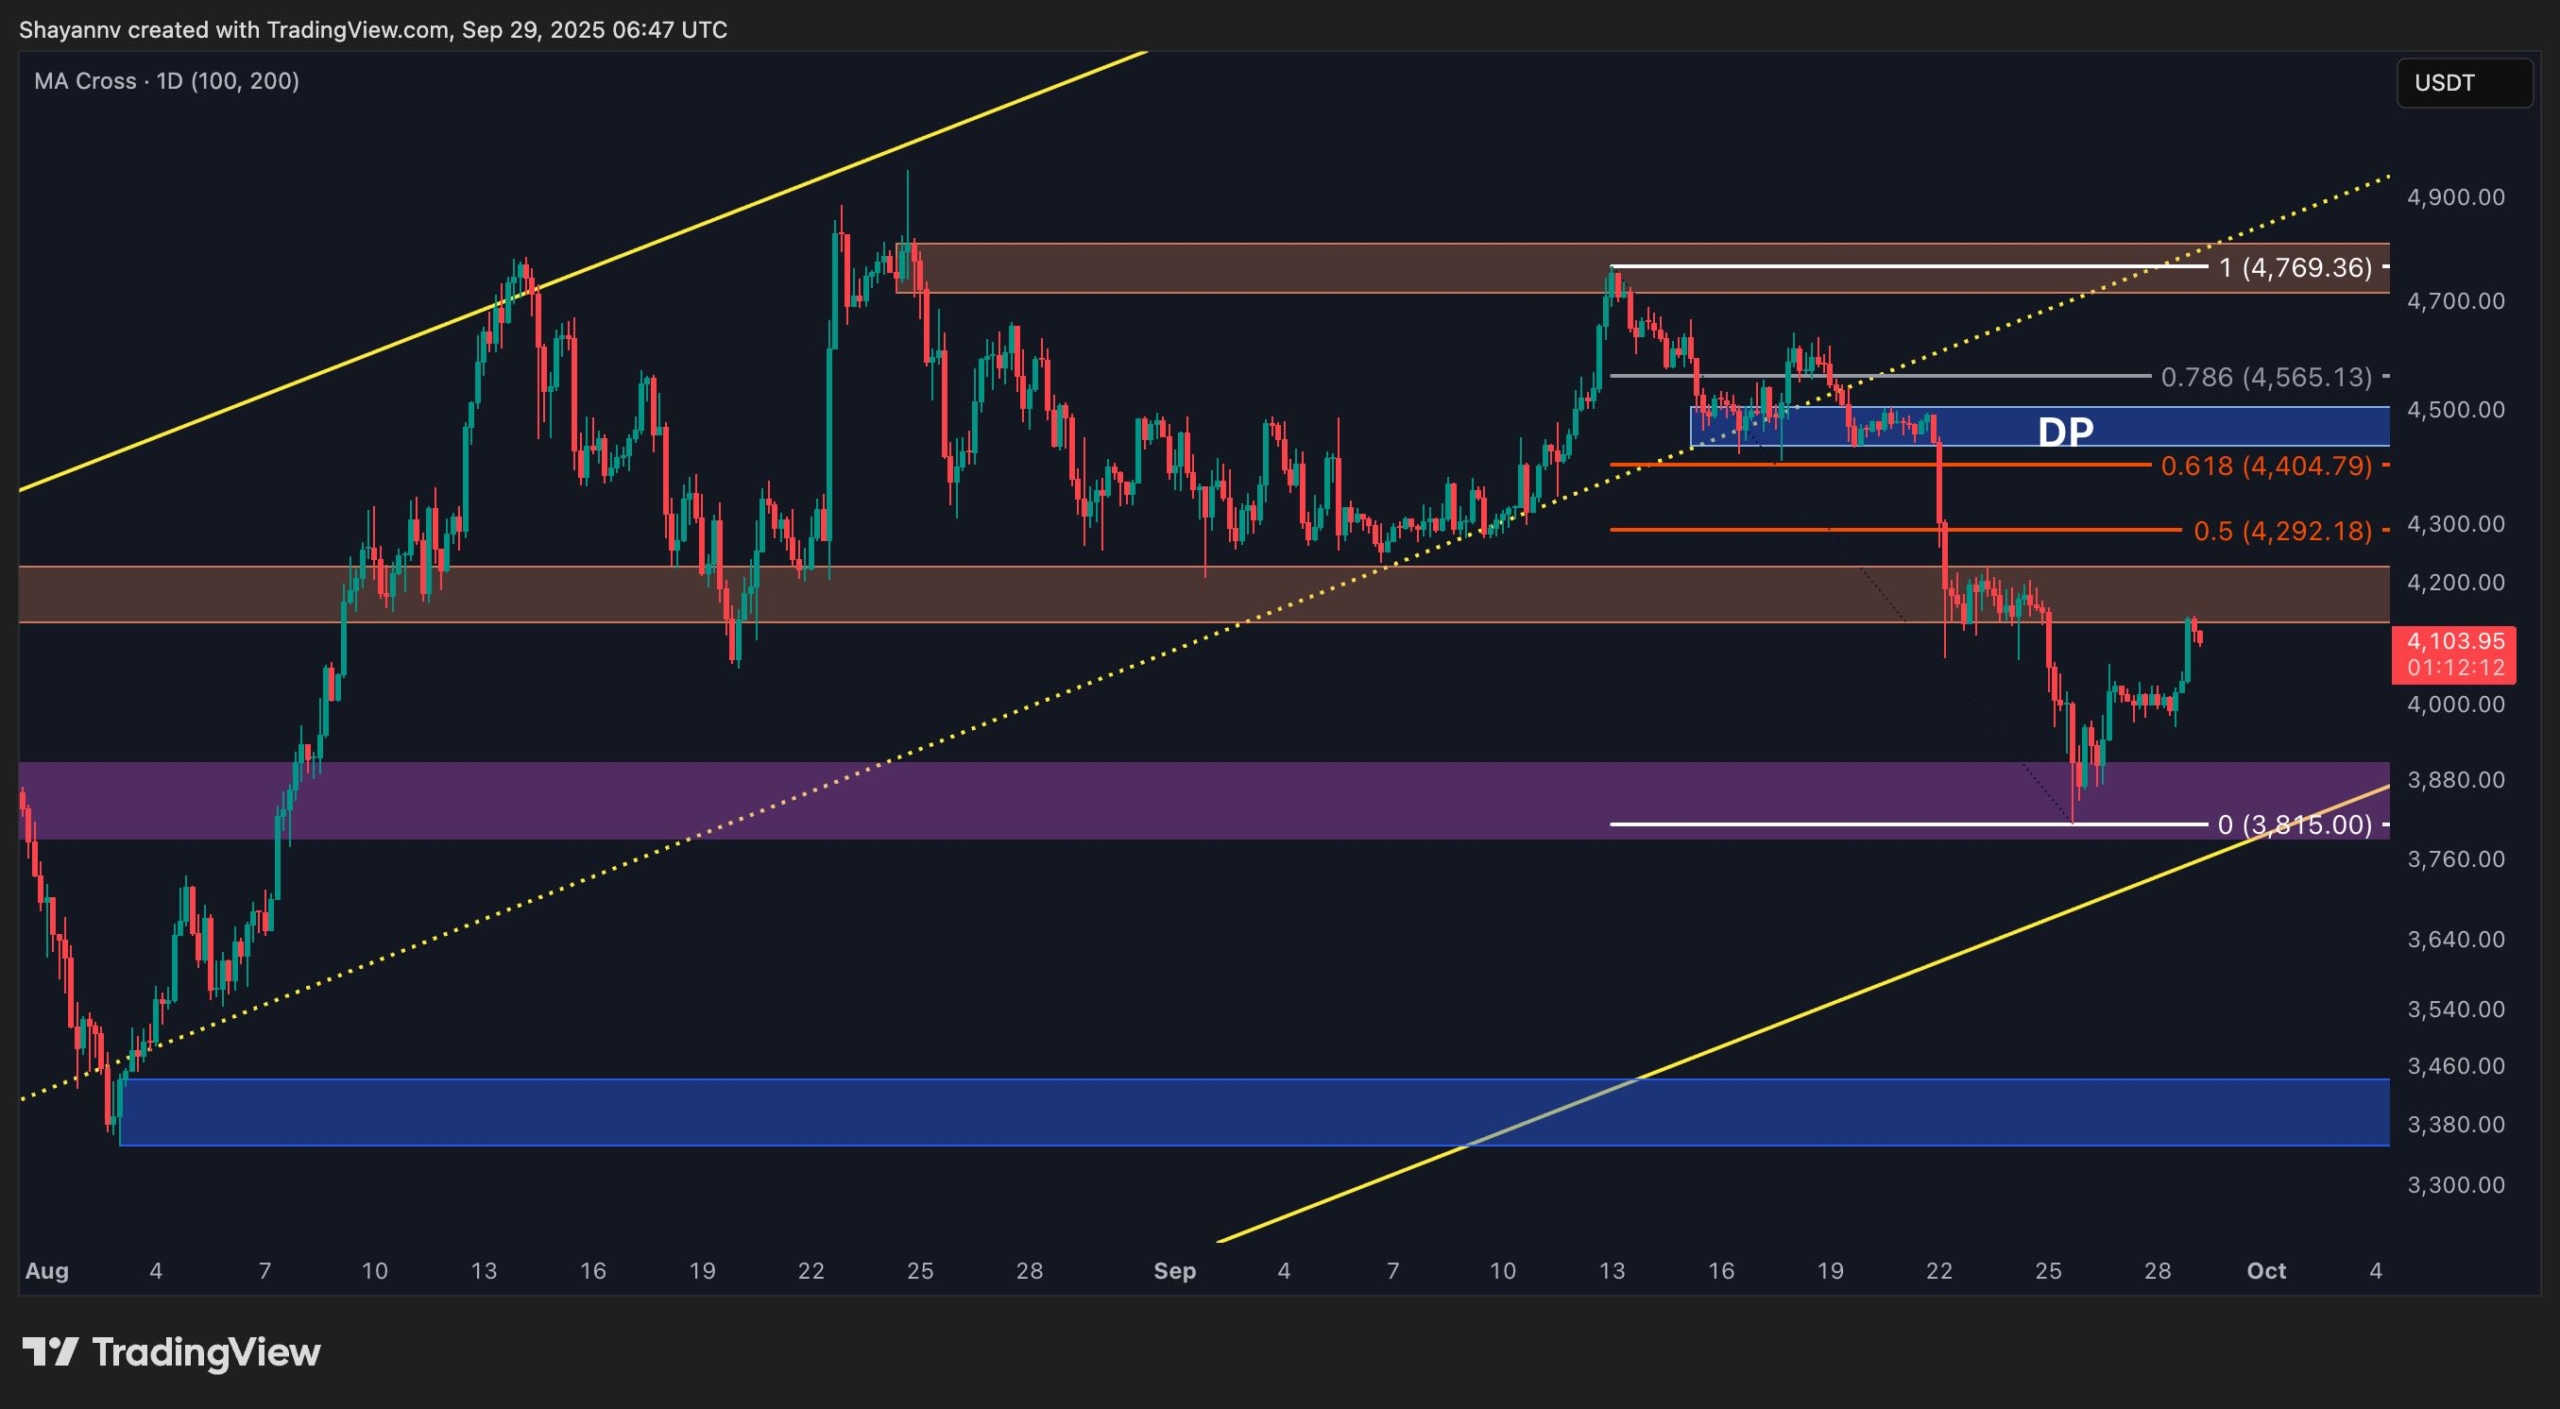
On the 4-hour chart, Ethereum sharply declined into the $3,800–$3,900 demand region, which overlaps with the channel’s lower boundary, and quickly attracted buyers. This bounce has lifted the price toward the $4,200 zone, where short-term resistance is now being tested.
Above this level, the $4,300–$4,400 range stands out as the next critical resistance, aligning with the decision point (DP) and key Fibonacci retracements.
A failure to reclaim momentum above $4,200 could force ETH into further consolidation, or even another retest of the $3,800 demand block. Conversely, a clean breakout would pave the way for ETH to revisit higher resistance zones, ultimately targeting the $4,600–$4,700 order block.
By Shayan
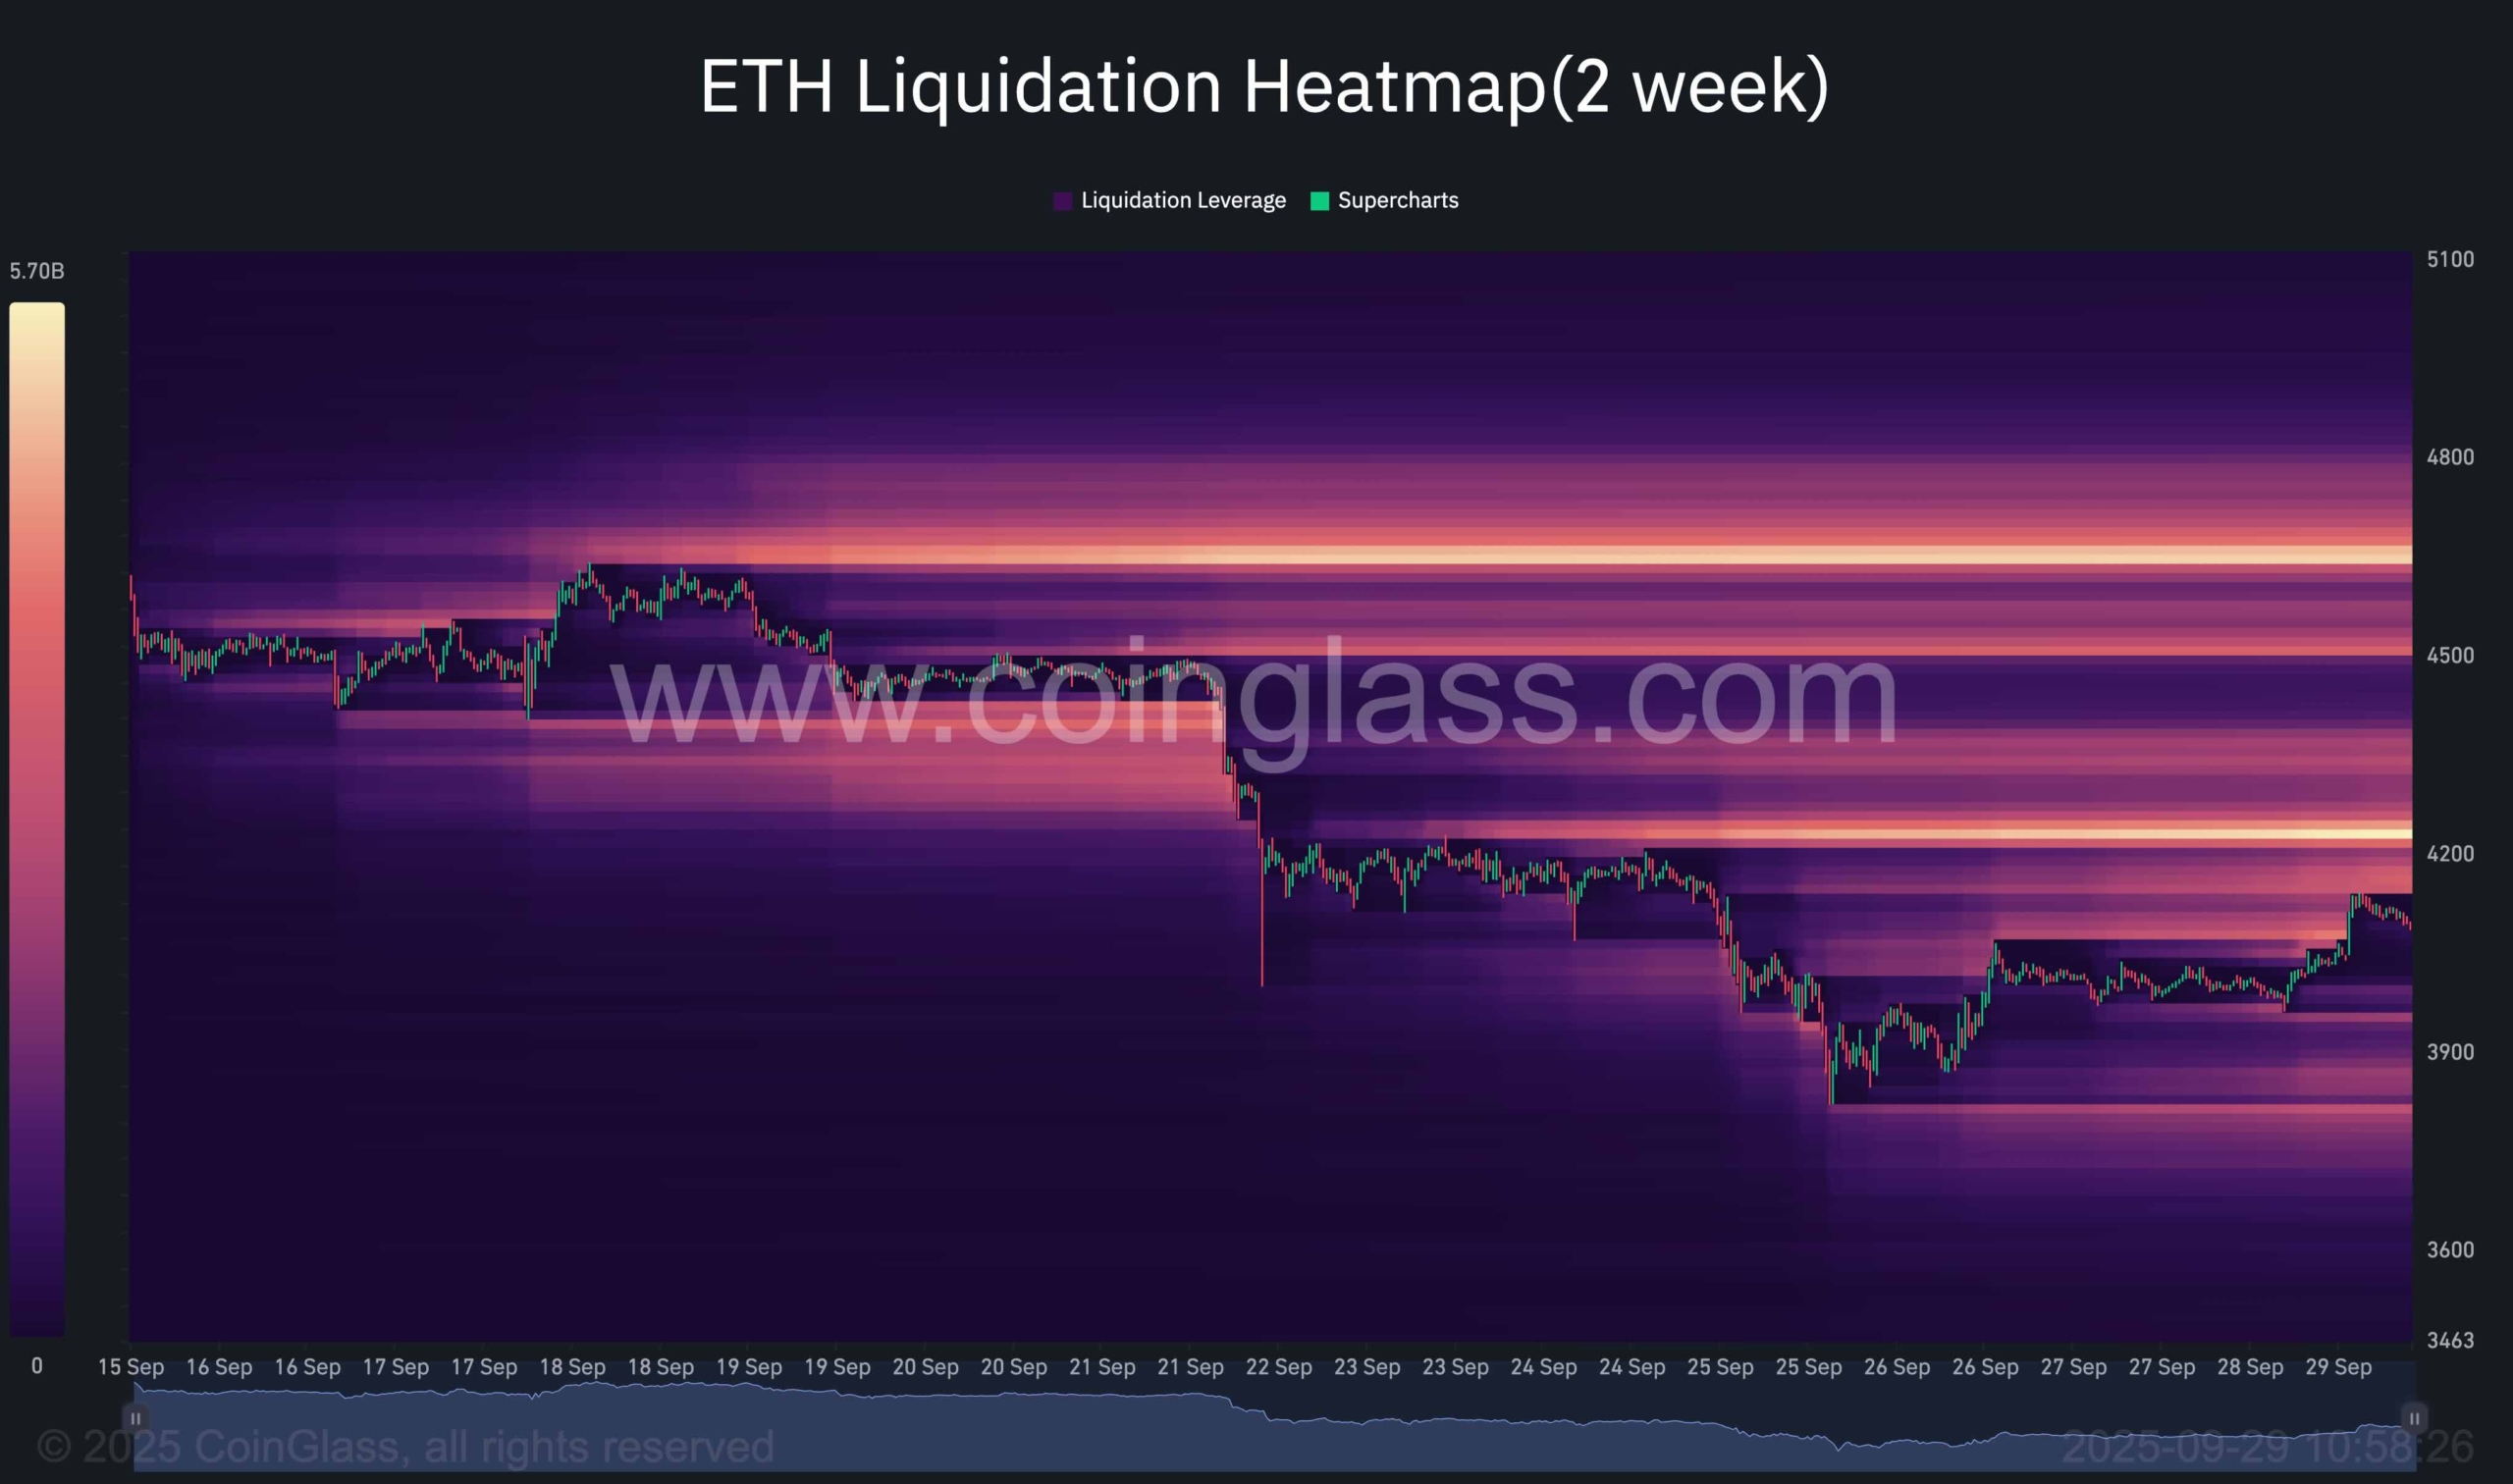
The liquidation heatmap highlights that Ethereum’s recent decline triggered a long squeeze, wiping out a dense cluster of overleveraged positions just below $3,900 before rebounding.
Currently, ETH is pressing against the $4,200 resistance, where another dense liquidity cluster has formed. This zone represents both a hurdle and a magnet for price action. If Ethereum successfully breaks above this area and clears the liquidity overhead, the next major concentration lies above the $4,700 swing highs.
This makes a liquidity sweep of those highs increasingly likely, as the market tends to gravitate toward such pools. In short, while buyers must first absorb the supply at $4,200, the larger liquidity resting above $4,700 suggests Ethereum’s path of least resistance remains tilted upward.
Binance Free $600 (CryptoPotato Exclusive): Use this link to register a new account and receive $600 exclusive welcome offer on Binance (full details).
LIMITED OFFER for CryptoPotato readers at Bybit: Use this link to register and open a $500 FREE position on any coin!
Disclaimer: Information found on CryptoPotato is those of writers quoted. It does not represent the opinions of CryptoPotato on whether to buy, sell, or hold any investments. You are advised to conduct your own research before making any investment decisions. Use provided information at your own risk. See Disclaimer for more information.
Cryptocurrency charts by TradingView.


