


Whether managing a project or working to understand, analyze and improve the steps involved in a business process to achieve a specific goal, decisions need to be made. Using a decision flowchart is a visual means to evaluate different approaches to understand which is best for the situation.
To understand what a decision flowchart is and how it works, we’ll first define the term and its approach. Then we’ll explain the symbols used in one, when to use it and provide some examples to help see it function in a real-life scenario. To help readers further understand, we’ll provide a free download of a decision flowchart template.
What Is a Decision Flowchart?
A decision flowchart, also known as a decision tree, is a visual tool used to illustrate a decision-making process, where each step involves evaluating different options based on certain conditions or criteria. It guides individuals or teams through a structured way of making decisions by mapping out potential outcomes and the actions that should be taken at each point.
There are different types of decision flowcharts. For example, a binary decision flowchart has only two possible outcomes at each decision point, typically yes or no, which is ideal for simpler decisions. There’s also a multifactor decision flowchart for more complex scenarios, such as ones that involve several conditions at each step and could lead to many different outcomes.
Whatever decision flowchart one uses, it’s only good to point one in the right direction. Once that course of action is clear, then project management software needs to be applied to schedule the tasks that will get one from where they are to where they want to be.
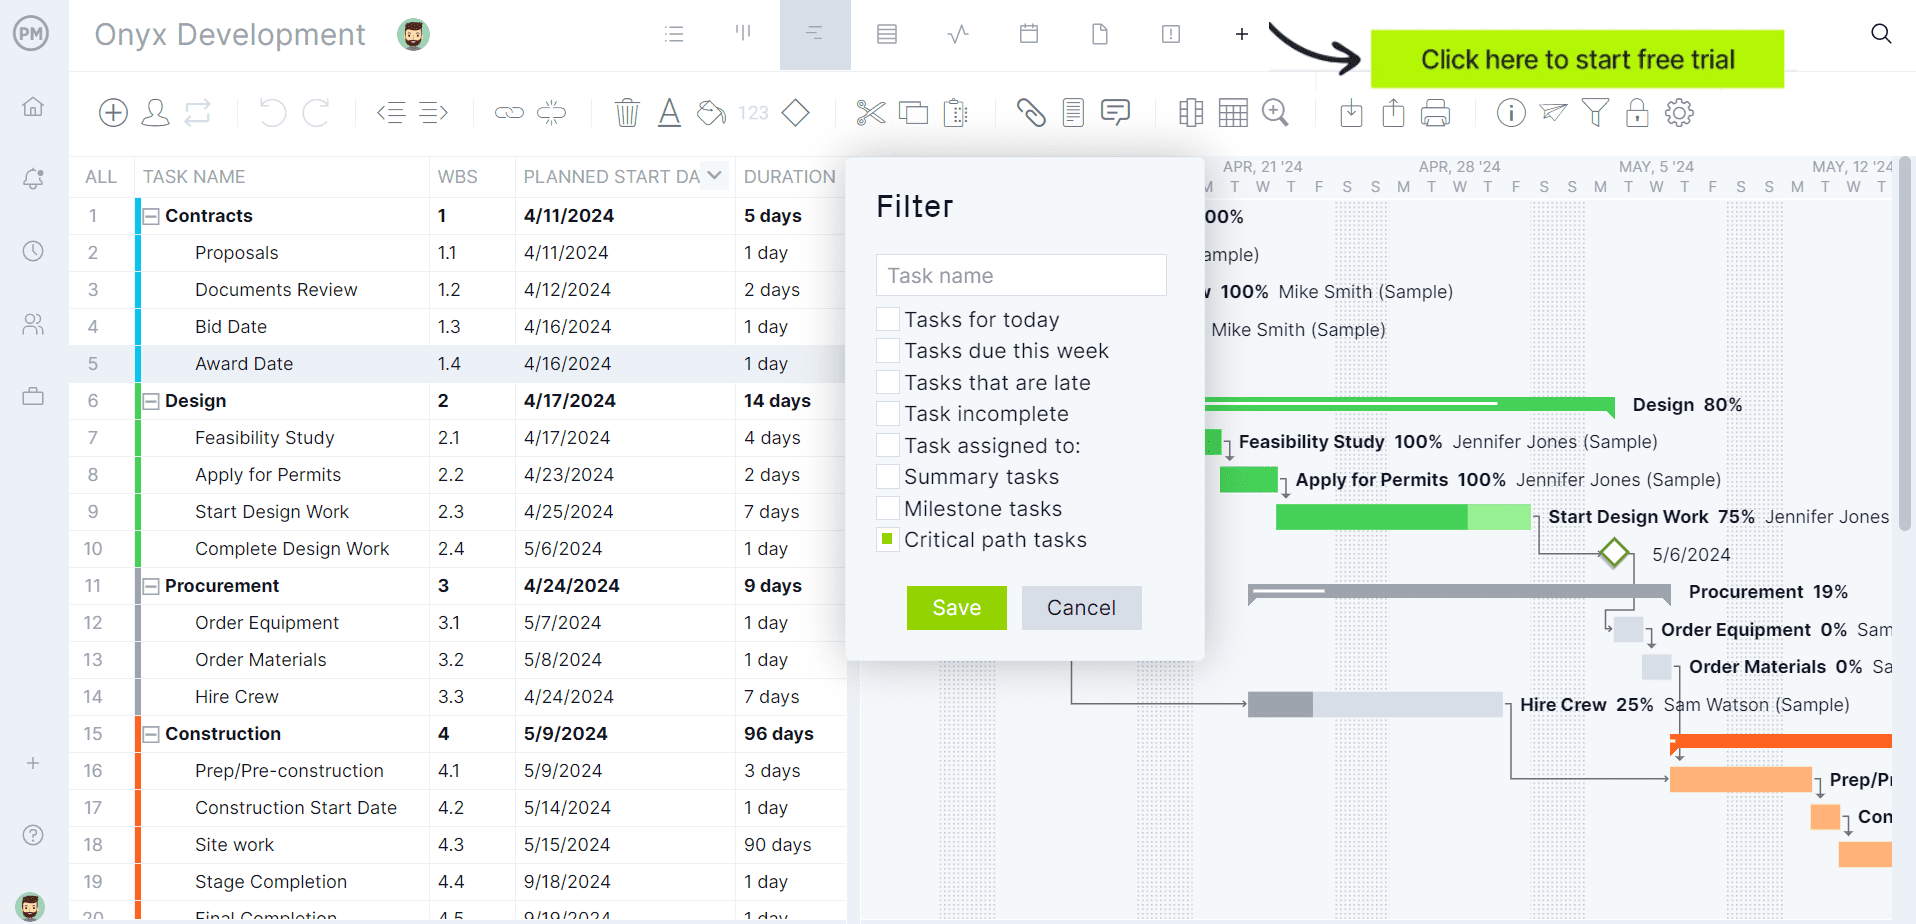
ProjectManager is award-winning project and portfolio management software with multiple project and scheduling views. There are robust Gantt charts to organize tasks, resources and costs, which also link all four types of task dependencies to avoid costly delays, filter for the critical path and set a baseline to track variance in real time. Teams can execute their tasks with kanban boards that visualize workflow or powerful task lists. Stakeholders can monitor progress on calendar views. Get started with ProjectManager for free.
How Does a Decision Flowchart Work?
A decision flowchart works by first identifying the decisions. That means, defining the primary decision or problem that needs to be solved. This is the trigger for the decision-making process. Next, break down the options for each possible decision. List the factors that will influence the next step. This could include questions like “Is the budget available?” or “Is the product compatible?”
Then map out the outcomes. For each condition or option, map out the possible next steps and their consequences, breaching out to show the various paths. Then, follow the logic. By following the flowchart, users can logically evaluate decisions step-by-step, ultimately arriving at a final decision or solution.
The flowchart concludes when all possible decisions lead to a final endpoint. This could be a decision, such as to proceed or reject the idea, or a recommendation, like further evaluation is required. For example, the endpoint could be the product launch complete or the project rejected for launch.
Decision Flowchart Symbols
What we left out from the above description of how a decision flowchart works is that throughout this process various symbols are used to represent different steps and actions in the decision-making process. Here’s a breakdown of the most common symbols used in decision flowcharts.
- Start/End: Oval or rounded rectangle
- Process (Activity/Action): Rectangle
- Decision: Diamond
- Input/Output (Data): Parallelogram
- Document: Rectangle with a wavy bottom edge
- Database (Data storage): Cylinder
- Connector (On-Page or Off-Page Reference): Circle or labeled connector
- Flow Line (Arrow): Arrow
- Parallel Mode (Concurrency): Double-line arrow or fork/join nodes
- Delay: D shape, half-circle
When to Use a Decision Flowchart
Several scenarios are appropriate for the use of a decision flowchart. It is particularly useful in situations where there are multiple options or factors to consider and the decision process involves a series of steps. The following are just a few examples.
Project Management
In project management, a decision flowchart maps critical decisions at each project stage. This includes resource allocation, timeline adjustments or scope changes. Beginning with the project’s starting point, adding decision nodes for key milestones and connecting actions based on outcomes. It ensures clarity and consistency, enabling teams to follow a structured process and adapt to challenges efficiently.
Business Process Management
A decision flowchart can be used in business process management to visualize workflows and identify bottlenecks or inefficiencies. Start with the input or task initiation and outline each process step with decision nodes that handle variations. The chart guides users to optimal paths, helping streamline operations, automate decisions and improve process reliability.
Strategic Planning
In strategic planning, a decision flowchart helps explore different strategies and evaluate their outcomes. Begin with the goal or objective, such as entering a new market, and add decision points. The flowchart helps align decisions with organizational goals, ensuring an analytical and consistent approach to strategy formulation.
Risk Management
A decision flowchart for risk management maps out potential risks and the steps to address them. Start with a risk event and add decisions. Each path leads to migration actions or contingency plans, ensuring proactive and systematic risk handling. This visual tool enhances preparedness and reduces response time.
Free Decision Flowchart Template
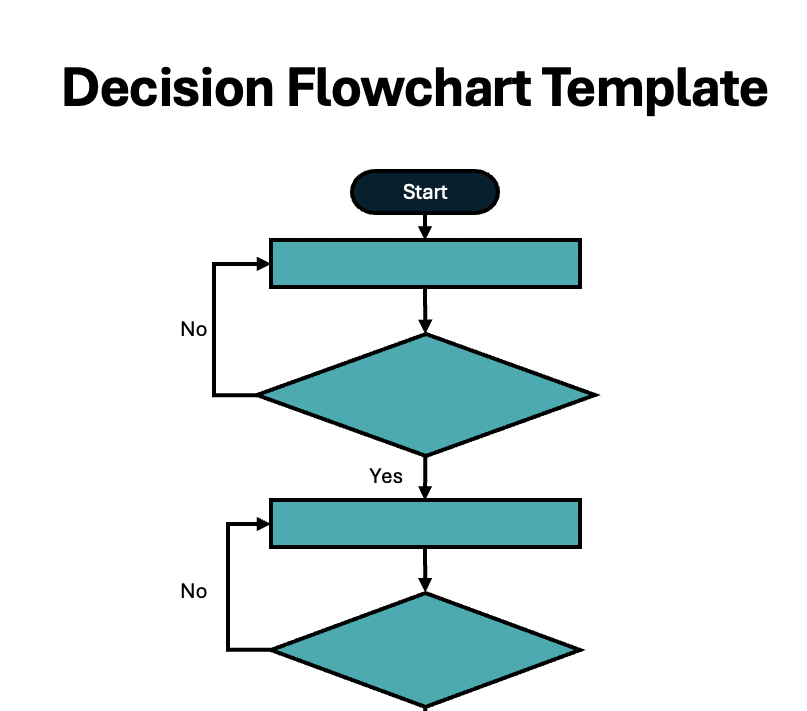
To try a decision flowchart, download this free decision flowchart template for PowerPoint. It has a key to all the symbols used in the flowchart to help understand their meaning. The two examples we included above can be edited to fit one’s decision-making process.
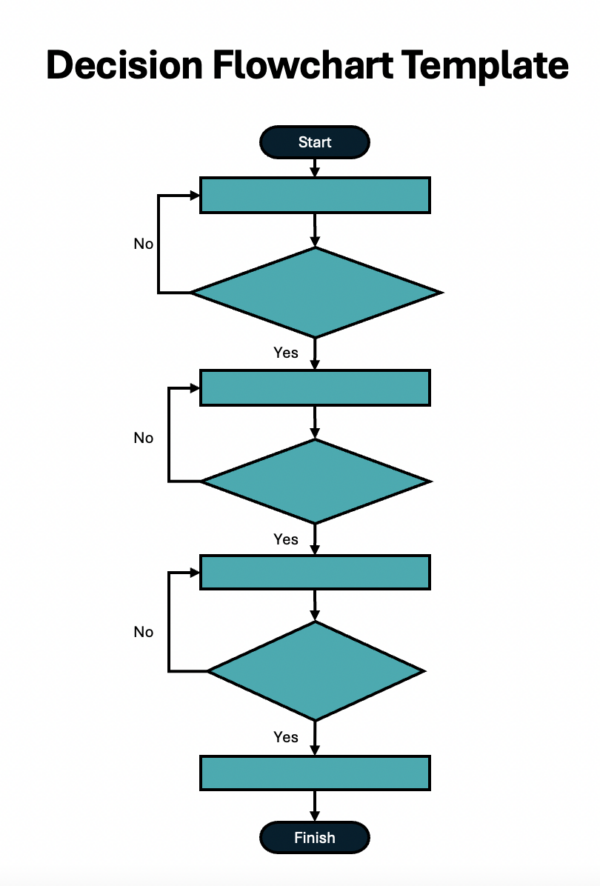
To employ this free template, use arrows to connect flowchart symbols to represent a decision flowchart. Copy and paste the symbols as needed and add the appropriate process or decision as it relates to what one needs guidance on.
Decision Flowchart Examples
To better understand the visual tool, it makes sense to see it used in a real-life situation. In both examples below, we describe the process and show what the decision flowchart looks like to clarify its value.
Project Planning Decision Flowchart
It begins with the oval start and then the process is defined, which in this case is to define the project scope. The first decision is if the project scope is defined. If not, go back to the initial decision. If yes, move on to making the project schedule.
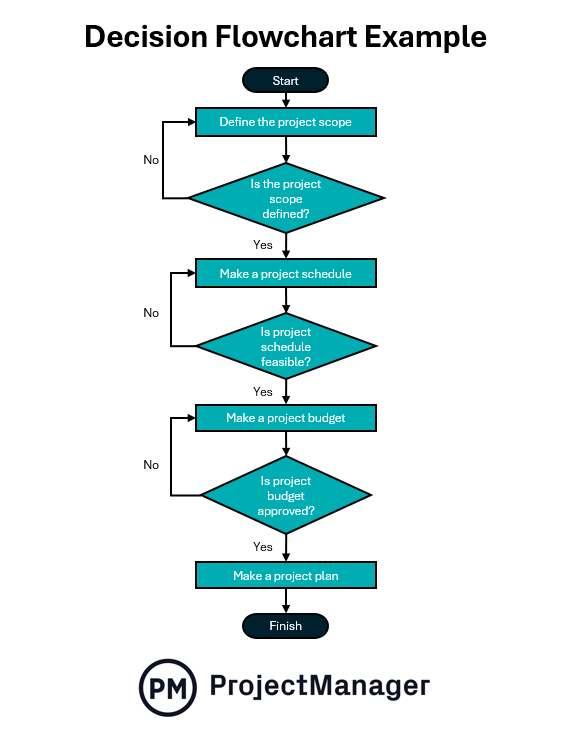
Next, ask if the project schedule is feasible. Again, if not, remake the project schedule. However, if yes, then create the project budget. The next decision is asking if the project budget has been approved. If yes, make the project plan and you’re done. If not, then revise the budget and try again.
Product Development Decision Flowchart
For this decision flowchart, the initial process is to conduct market research. This leads to whether the market research is completed. If yes, move on. If not, go back and complete that market research.

The next process is to ensure strategic alignment. This leads to the decision of whether the product is aligned with company goals. Again, if not, go back and ensure the strategic alignment. If yes, the next process is to make the budget. The decision after that is to get the budget approved. If it is, prepare the product launch. If not, rework the budget until it’s approved.
Get your free
Decision Flowchart Template
Use this free Decision Flowchart Template to manage your projects better.
Benefits of Using a Decision Flowchart
There are several reasons why a decision flowchart is useful. Here are just a few.
- It simplifies complex decisions by visually breaking down all possible options and outcomes
- It helps one focus on the important factors that affect the decision, ensuring that critical considerations aren’t overlooked
- Ensures that the same steps are followed each time a similar decision needs to be made, promoting consistency in decision-making
- Makes complex decisions easier to navigate by turning them into manageable, logical steps
Disadvantages of a Decision Flowchart
While decision flowcharts are valuable tools for visualizing decision-making processes, they come with some disadvantages. These limitations may reduce their effectiveness in certain situations. Here are some.
- When the decision process involves a large number of steps, conditions or complex decision points, the flowchart can become hard to follow
- Creating a decision flowchart, especially for complex processes, can be time-consuming and require a significant amount of effort to map out all decision points and outcomes
- A flowchart enforces a predefined structure that may not always be adaptable to changes in the decision-making process
- A decision flowchart typically works well for processes that involve yes/no or clear-cut binary decisions, but they may struggle with more nuanced or subjective decision-making that involves multiple possibilities or judgment calls
Free Related Templates
There are other free templates available from our site that can help with decision-making. We have over 100 free project management templates for Excel and Word that cover all aspects of managing a project across multiple industries. Below are just a few that relate to the decision flowchart.
Decision Matrix Template
A decision matrix helps evaluate and prioritize a list of options to identify, analyze and rate sets of information. Use this free decision matrix template for Excel to place a series of values on each decision to compare each and weigh variables by importance.
Fishbone Diagram Template
Download this free fishbone diagram template for Word, also called a root cause analysis template, to identify what issue is causing a process not to conform to the planned output. This cause-and-effect diagram finds imperfections, variations, defects or failures in a process or project.
Scenario Planning Matrix Template
Use this free scenario planning matrix template for Excel to look at the big picture. It’s a simple box that’s broken up into four quadrants, each of which holds a different scenario. This allows users to capture the important and uncertain key forces that can impact each of the different scenarios.
ProjectManager Helps Manage Projects, Business Processes and Workflows
All of these free templates are great. They’re tools that every project manager and their team needs to help them make decisions. However, once those decisions have been made, projects, business processes and workflows require project management software to deliver on the promise of the decision-making process. ProjectManager is award-winning project and portfolio management software with various project planning and scheduling tools needed to achieve project and strategic goals, business processes and risk management. Our risk management features identify the likelihood and impact of a risk and track the mitigation factor in the knowledge gleaned from a decision flowchart. It then becomes a practical tool to avoid issues that can delay projects or result in cost overruns.
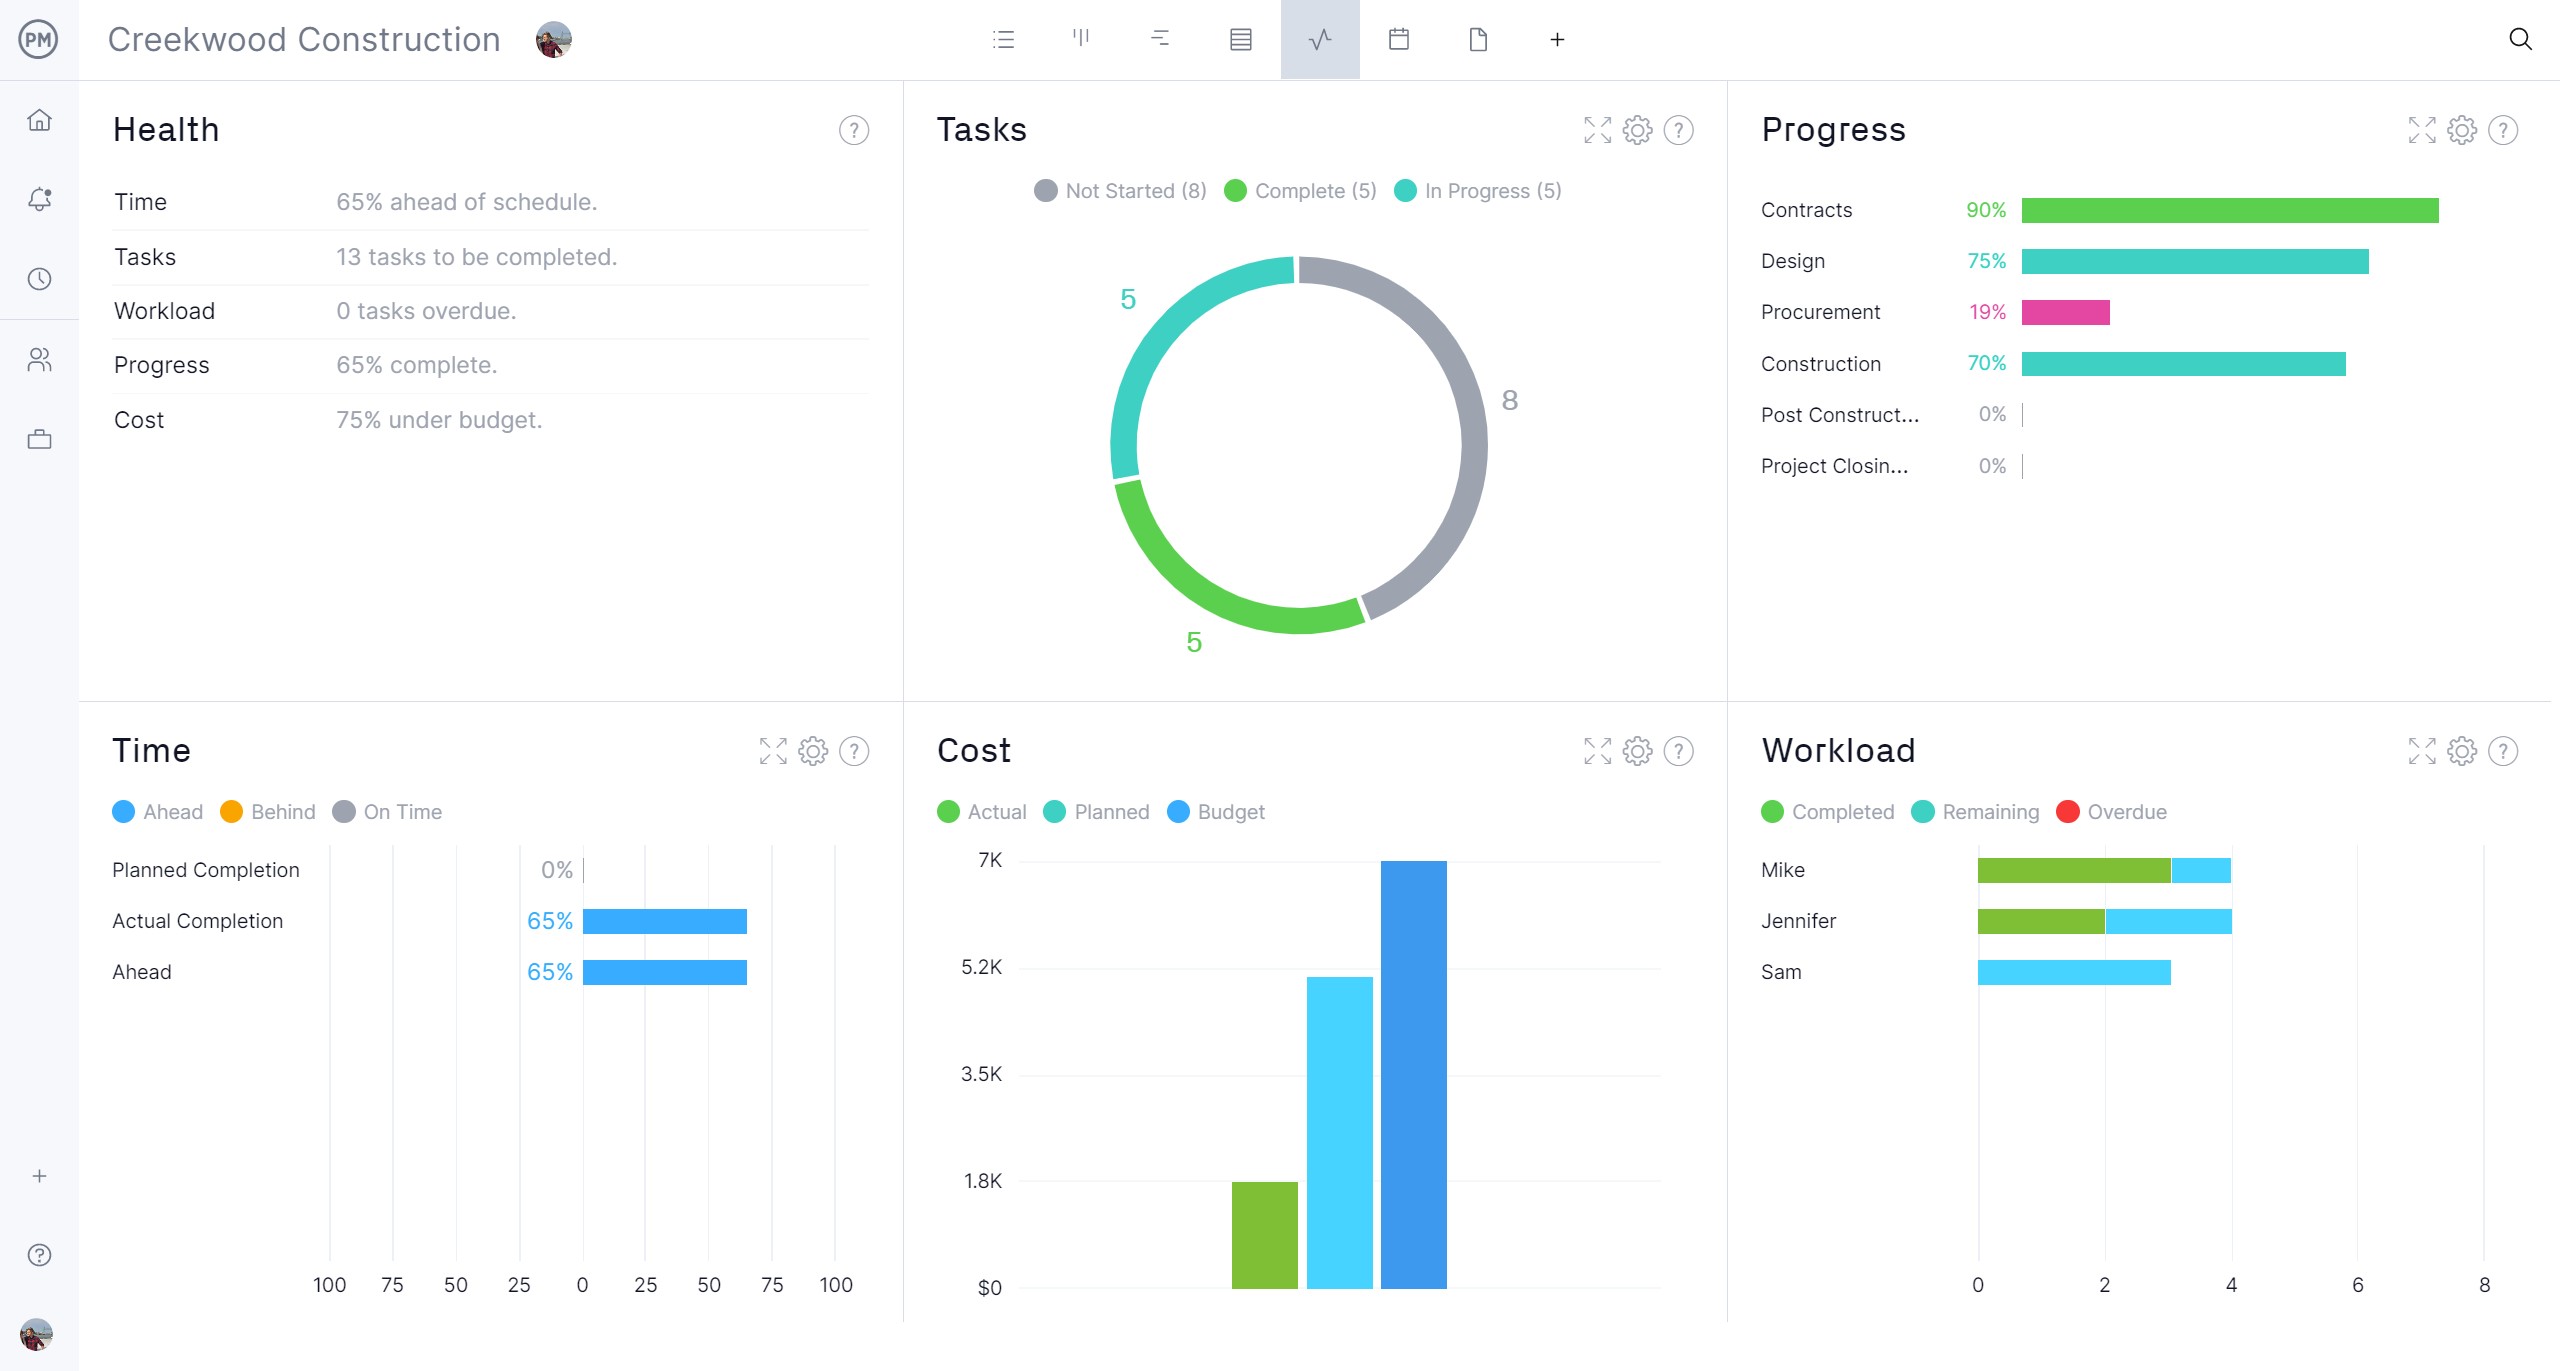
Real-Time Dashboards and Reports
Ensuring that processes and plans are being followed and teams are keeping to deadlines requires the constant monitoring of progress and performance. Managers can get a high-level overview of cost, time, workload and more on our project and portfolio dashboards, which display these KPIs in easy-to-read graphs and charts. It’s like an instant status report. There are also status and portfolio reports, as well as reports on timesheets, workload, variance and more. These customizable reports can be filtered to display details or a more general overview to share with stakeholders and keep them informed.
Robust Resource Allocation and Cost Tracking Features
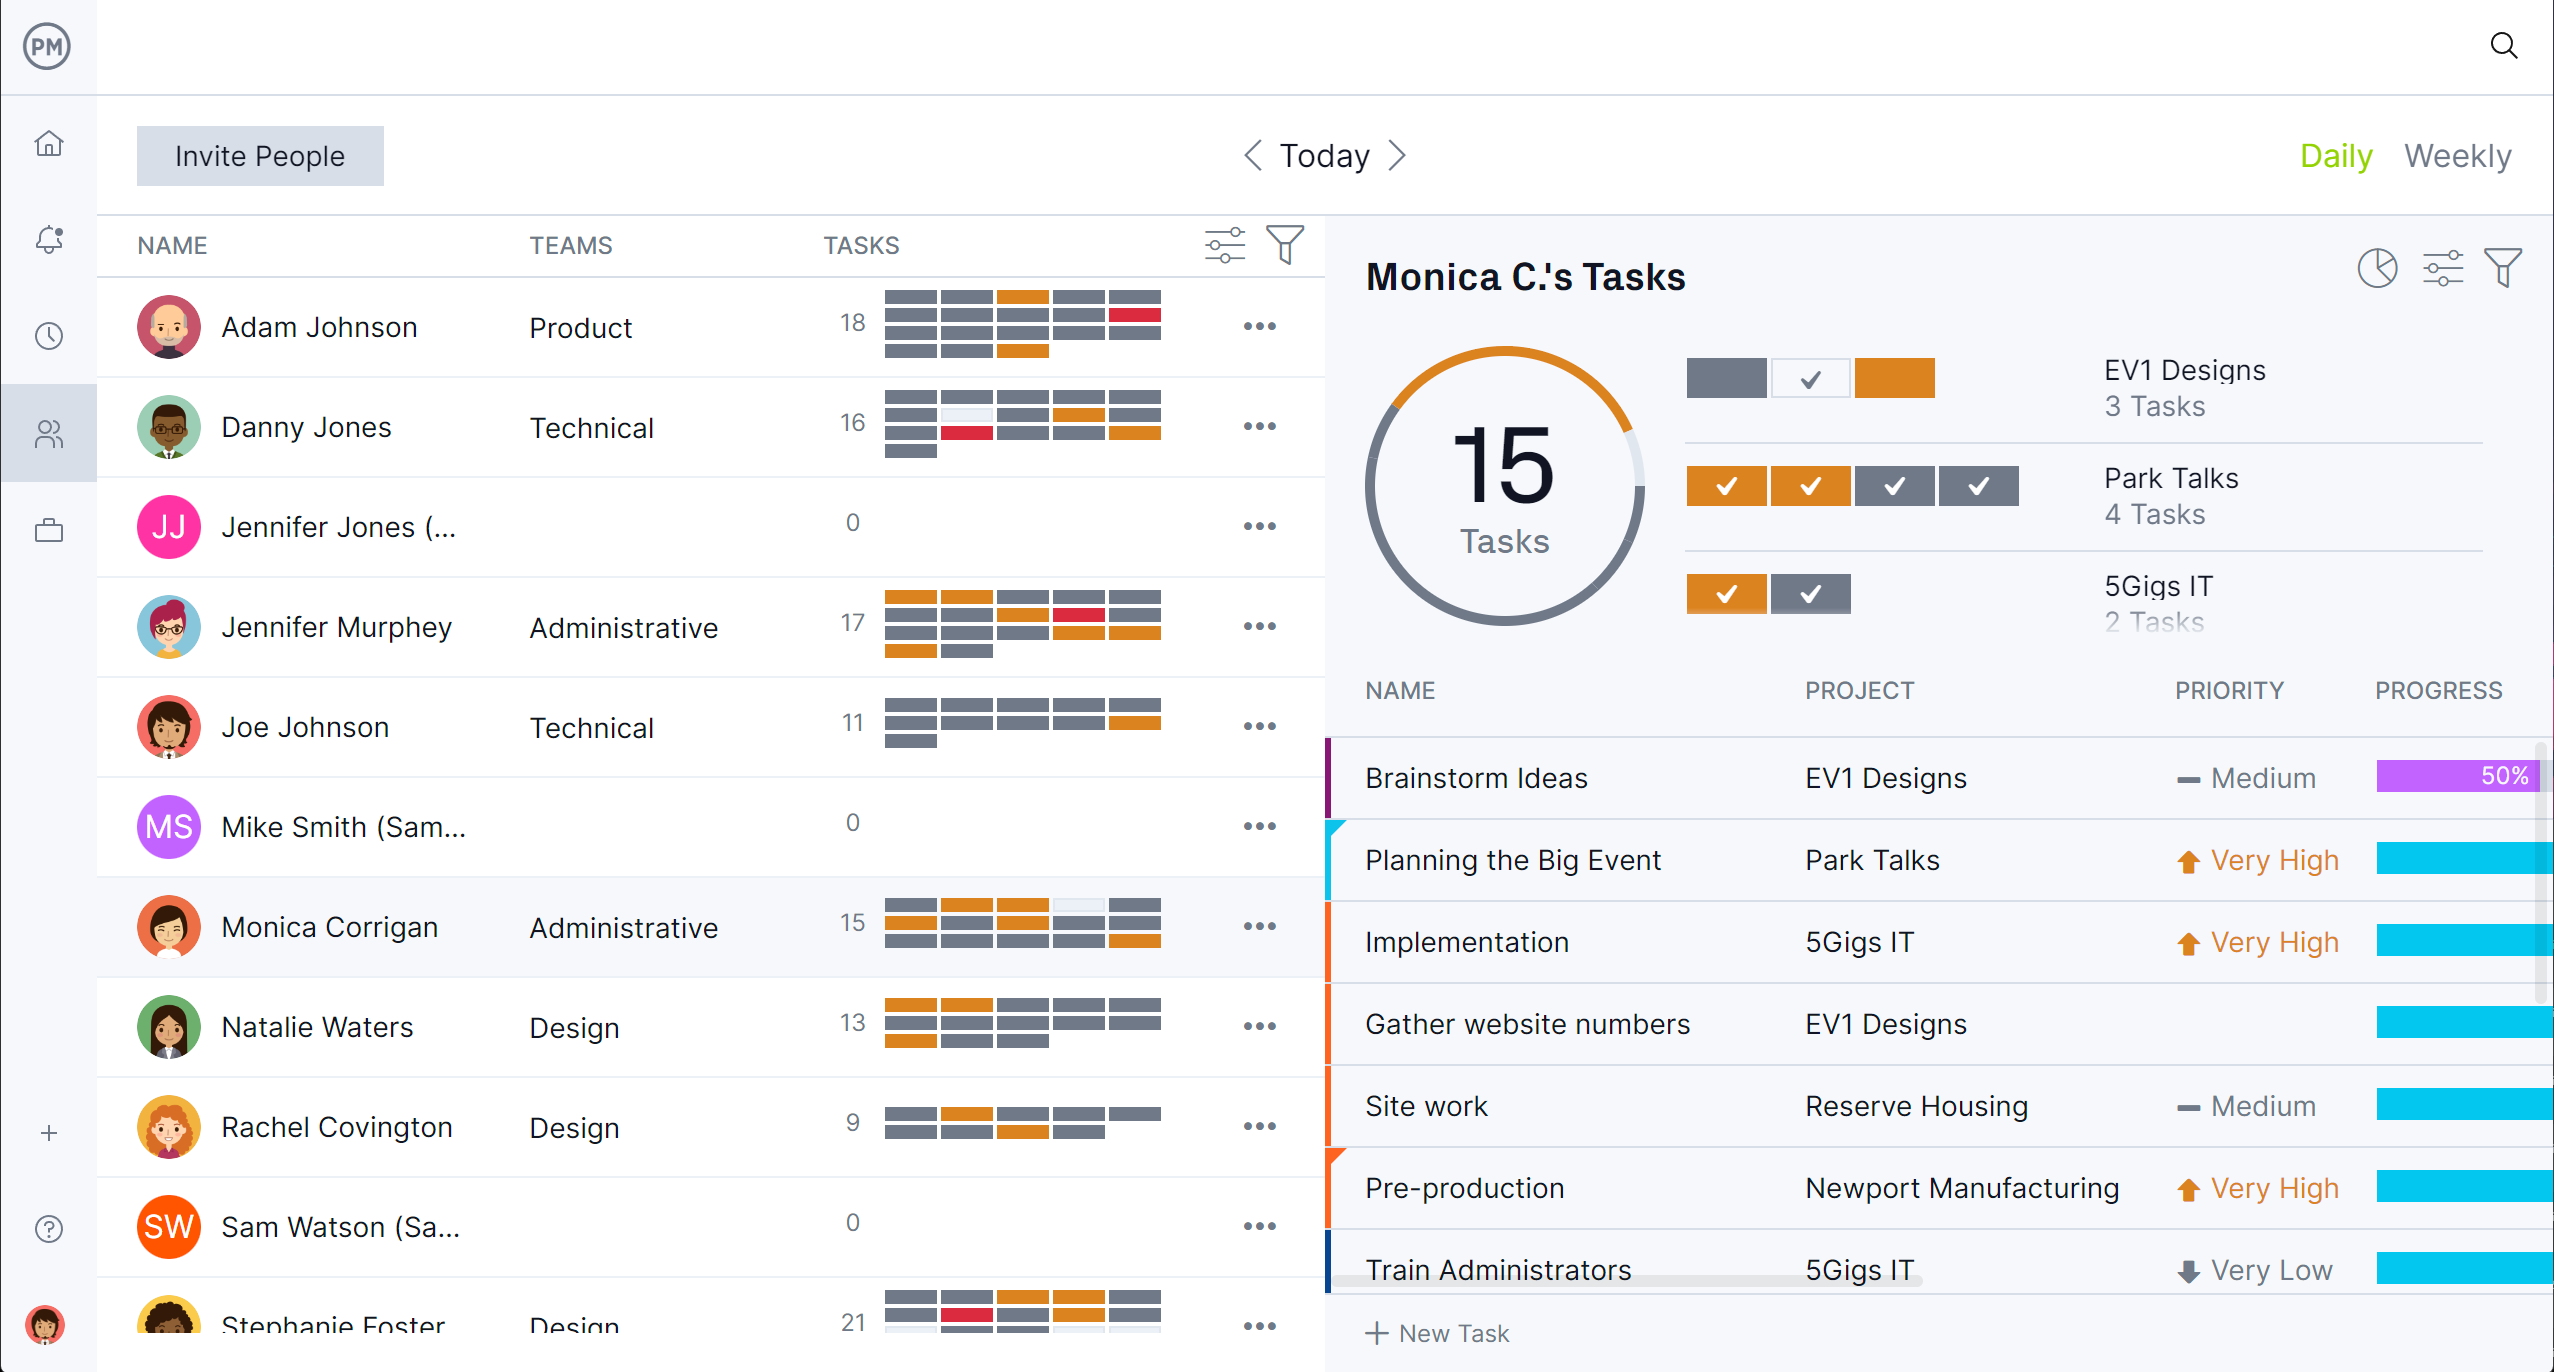
Another crucial task for project managers is ensuring the right resources are delivered at the right time. This process begins with scheduling human and nonhuman resources on the Gantt chart. Then managers can view their team’s allocation and more on color-coded workload charts to balance workload and keep everyone working at capacity and avoiding burnout. There’s also the team page, which provides a daily or weekly overview of the team’s assignments color-coded by priority. Managers can filter the page by project, progress, etc., and click on individual team members for more detailed information. Costs can be tracked on dashboards and reports, but also secure timesheets, which provide a window into labor costs and help keep projects on budget.
Related Content
For those interested in learning about other charts to help with project management or different decision-making techniques, below are some links to recent articles on those topics.
ProjectManager is online project and portfolio management software that connects teams whether they’re in the office, out in the field or on the job site. They can share files, comment at the task level and stay updated with email and in-app notifications. Join teams at Avis, Nestle and Siemens who use our software to deliver successful projects. Get started with ProjectManager today for free.


