


One way to understand project management is by illustrating the process using project plan examples. This starts by defining what a project plan is, but then we’ll get into how it works in a real-life scenario.
We’ll first define a project plan and outline what goes into creating a project plan document. Then we’ll show how it works by illustrating several project plan examples.
What Is a Project Plan?
A project plan is a foundational document that outlines the goals, scope, timeline, resources and key deliverables. It serves as a roadmap to guide teams through execution and ensures everyone is aligned on the objectives and how they’ll be achieved. The plan typically includes tasks, deadlines, roles and risk management strategies—making it essential for setting direction.
However, while the project plan is critical, it’s not enough to effectively manage a project in real time. Projects require active coordination, dynamic scheduling, progress tracking, resource allocation and real-time communication, capabilities that go beyond what a static document can provide. That’s where project management software comes in. These tools bring your project plan to life by helping you organize workflows, track milestones, collaborate with your team and quickly adapt when things change, ensuring your project stays on time, on budget and target.
ProjectManager is award-winning project and portfolio management software that schedules and plans work on robust Gantt charts. Create plans that schedule tasks, resources and costs and link all four types of task dependencies. Then, toggle to the sheet, board, list or calendar views to see how plans are evolving in real time, or use one-click reports and dashboards to transform data into charts and graphs. If needed, share pertinent details with stakeholders using free guest licenses. Get started with ProjectManager today for free.
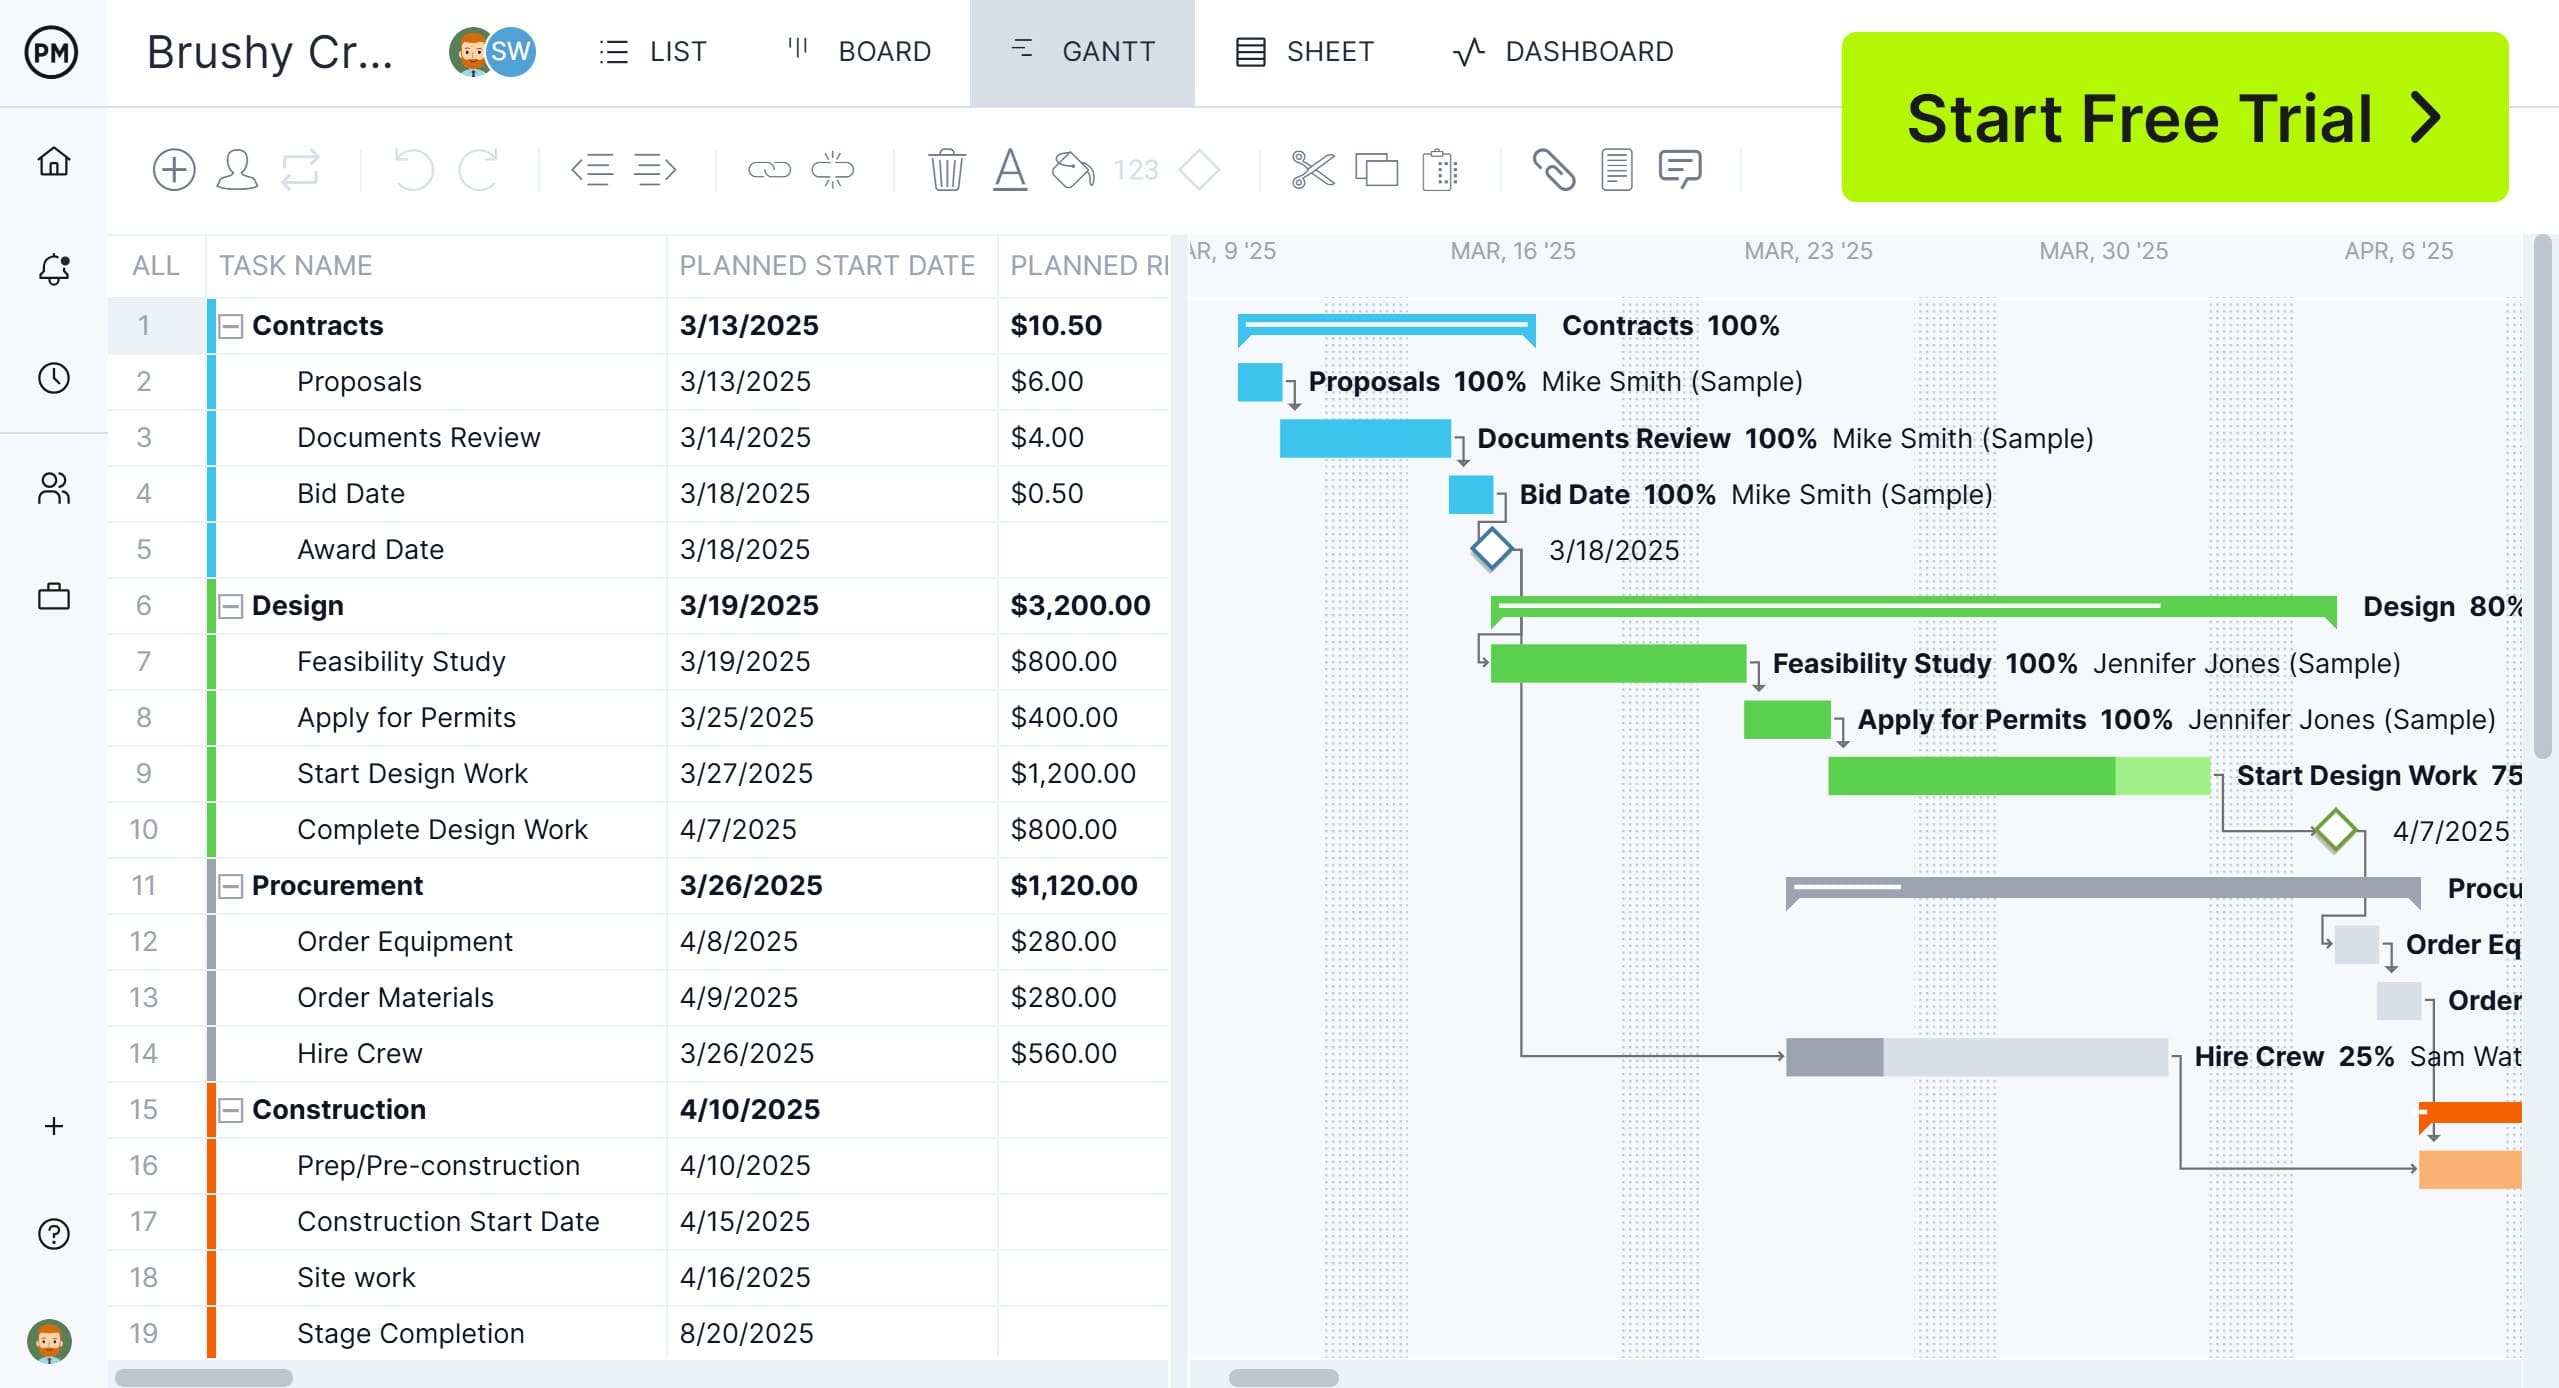
In this construction project plan example, the plan is scheduled on a Gantt chart. This breaks the larger project into smaller stages, as seen in the screenshot below. There is a stage for contracts, design, procurement, construction, etc.
The project begins with document management and moves into permitting and procurement. Different colors define these sections to make it easier to distinguish at a glance. This sets up the project for when the construction begins, which is the longest phase of the project, as seen in the bar chart.
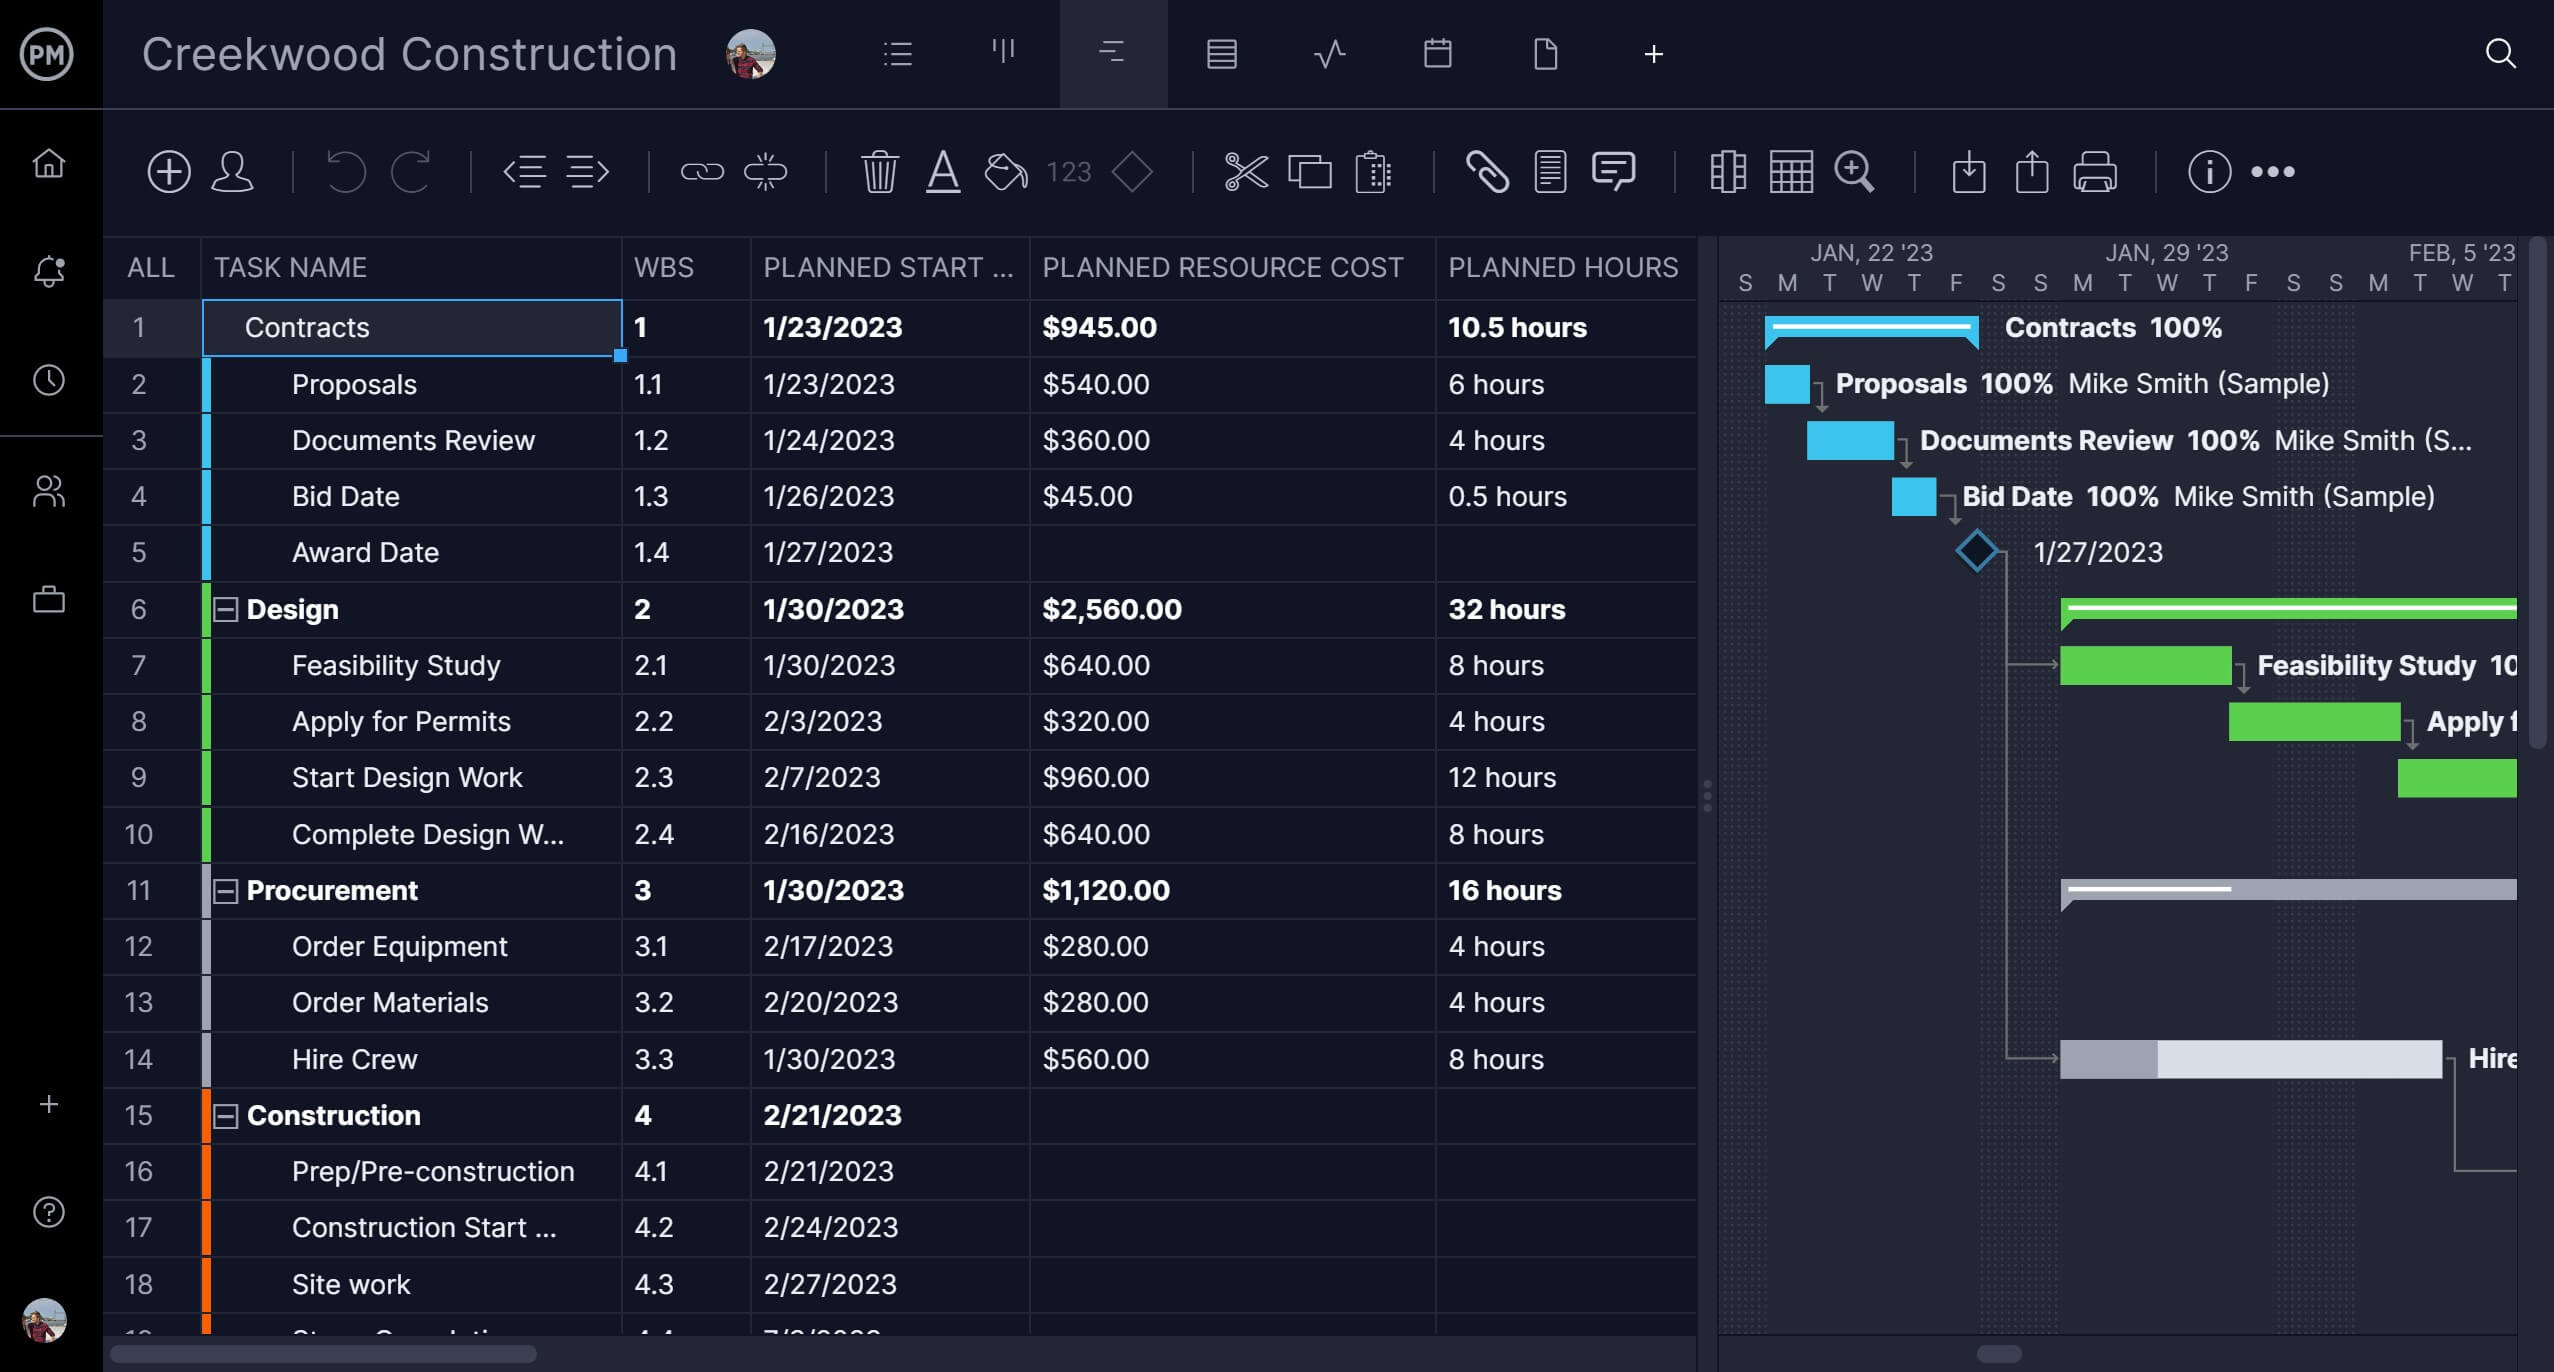
The Gantt chart also shows the planned start for each task, the planned resource cost and the planned hours for the task duration. When a baseline is set, the actual time, cost, etc., can be compared to the plan to track if the project is on schedule. On the right side, those tasks are displayed on a bar chart, which visually represents the project.
The Gantt chart can also be used for event planning. Here, the event is again broken down into phases; only these phases are planning, promotion, event prep, etc. Under each of these phases are the tasks that are necessary to complete them. Like the other Gantt charts, there are columns to show the planned effort.
Events begin with preparation, which can be viewed in the planning phase, which includes everything from finding the right venue, contracting with speakers and creating a list of attendees. This is followed by the marketing arm of the project, which grows awareness for the event through advertising, whether online or through physical media. As the event date nears, the site is set up and throughout the event, security, food services and other contractors or coordinated to ensure everything runs smoothly.

An event is also a project plan example, featuring phases and tasks. Just as in other Gantt charts, the plan is divided into a spreadsheet on the left and a bar chart on the right. The bar chart can also be colored to make it visually easier to see the different phases. Some tasks dependent on one another are shown linked on the chart.
The Gantt chart is a versatile tool used in many industries. We’ve already shown it employed in construction and event planning. Here, it’s being used to plan a manufacturing project. Though the industry is different, one can see that the layout is roughly the same.
Manufacturing a product begins with setting goals based on what customers want and then creating prototypes that are tested to ensure they are meeting that demand. This leads to setting up production to mass produce this product, which also involves various points in that production where the product is tested to ensure it’s meeting quality standards. While the product is being manufactured, other departments, such as marketing, are working on creating interest and knowledge of the product. The sales team is getting orders. All of this is coordinated so that product and delivery meet demand.
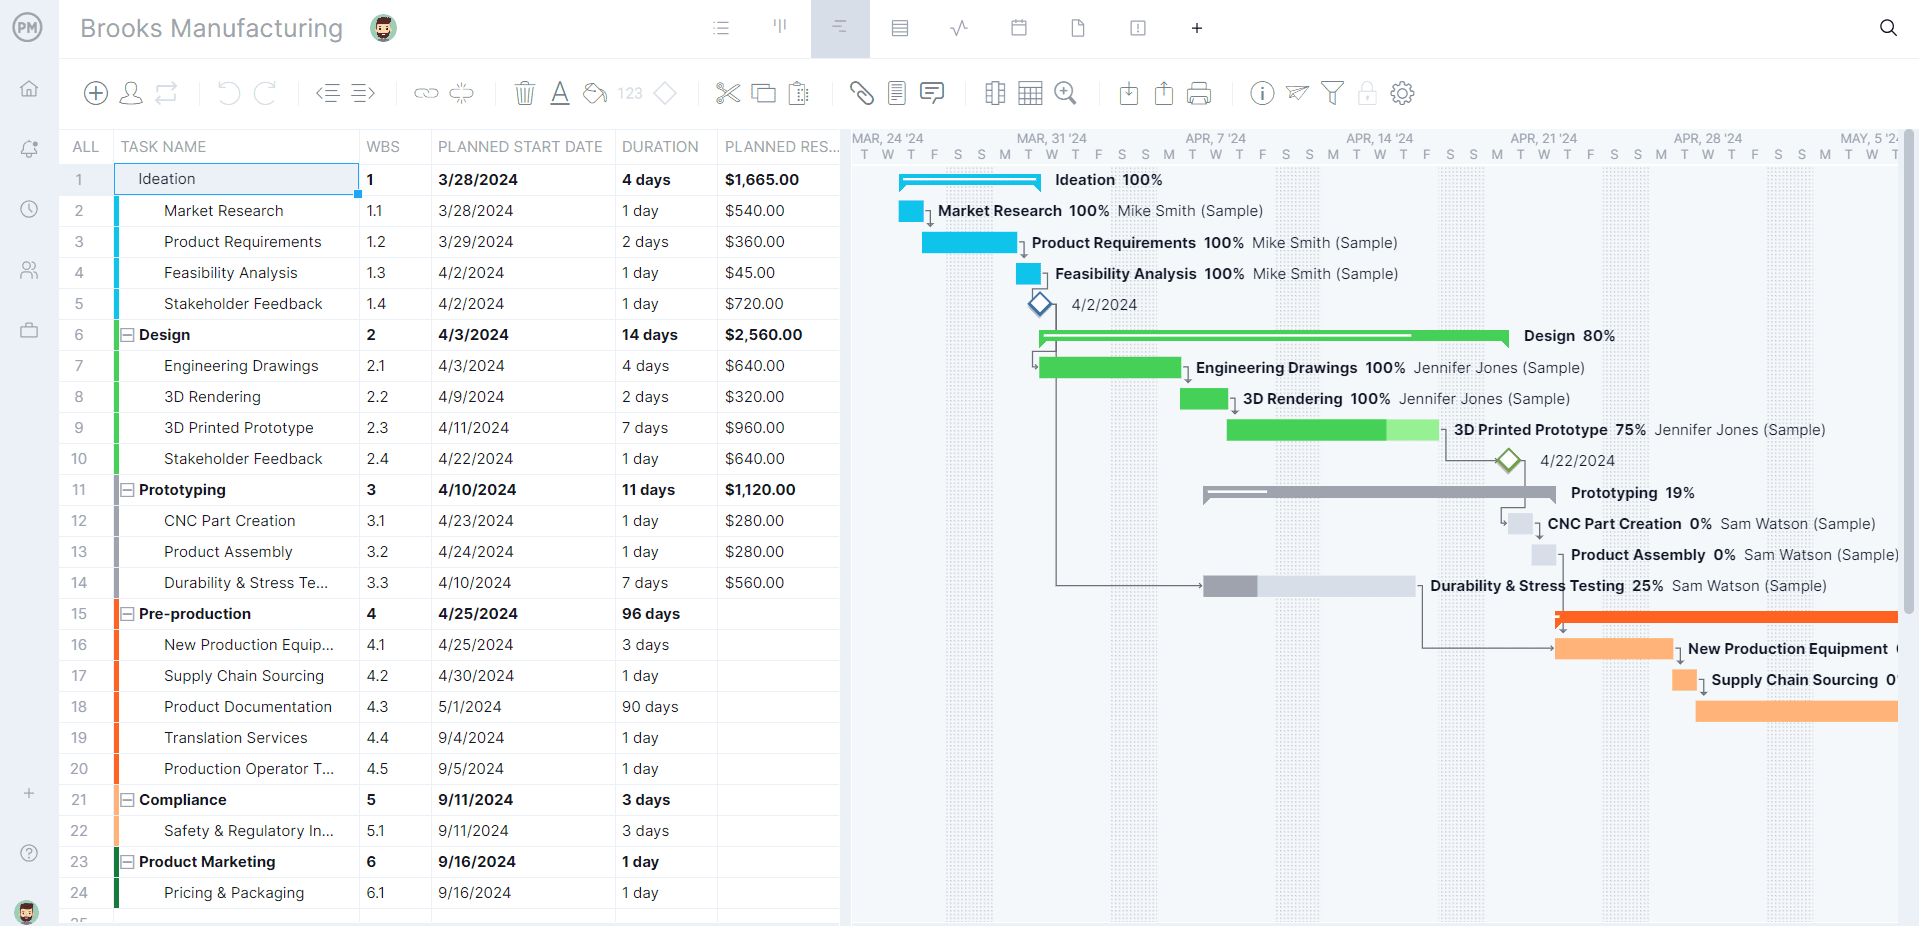
Again, the project plan example is broken down into phases. The difference is that these phases relate to the manufacturing industry. They show a design phase, prototyping phase, pre-production and so forth. However, the tasks, though different, are displayed in a bar chart to the right.
This project plan example is also on a Gantt chart. It’s an IT project and follows the course of an IT project, with phases for design, development, testing and so forth. But again, one can see that the project plan is illustrated no differently than plans in other industries.
Initiation starts the planning process, defining goals and writing a project charter. Then, define the technical details of the software product, including screen layouts, database structures and system interfaces. Next, there is refinement and the development of blueprints for developers. Testing ensures the planned system or software meets requirements, detects defects and verifies functionality before implementation.
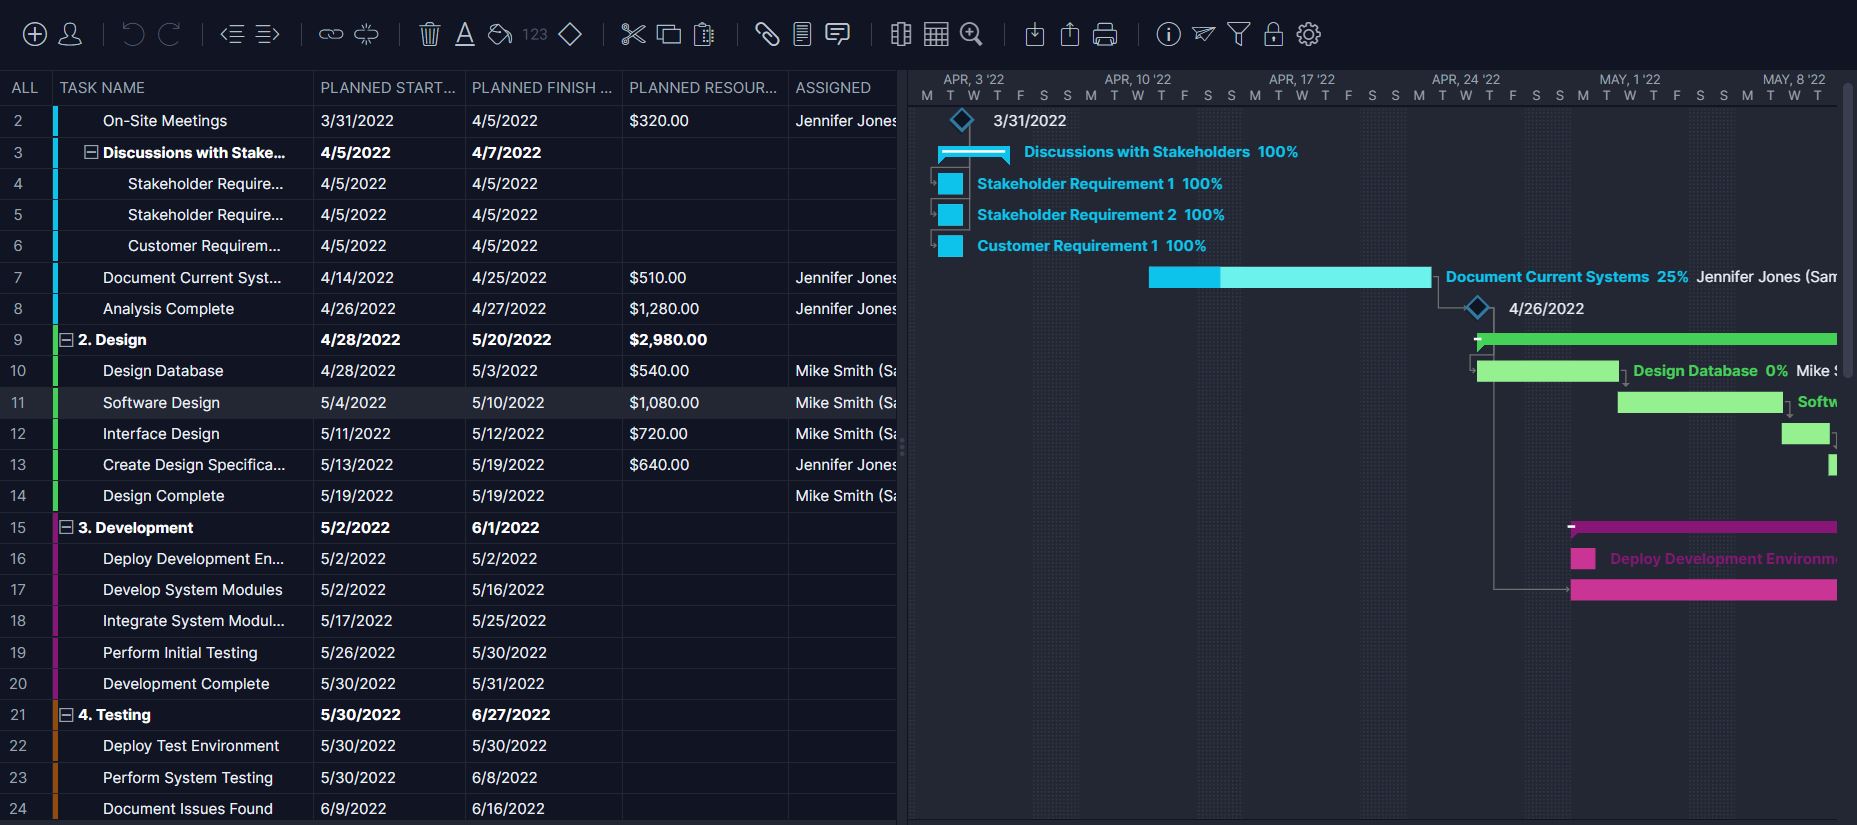
That’s because the Gantt chart is the perfect tool for any structured project that starts with one phase and doesn’t move to the next until that phase is finished. That’s why Gantt charts are the preferred tool of project managers working in a structured environment.
While Gantt charts are preferred, especially when they’re part of a project management software, an Excel spreadsheet can also be used. Below is an action plan, which, like a Gantt chart, breaks the project down into phases and tasks.
The action plan is made up so that each line of the spreadsheet is dedicated to a specific task, including its priority, resources required to execute it and a column for status, which shows the percentage complete. This helps track the work so it can be completed as scheduled. However, unlike project management software, a spreadsheet must be manually updated.
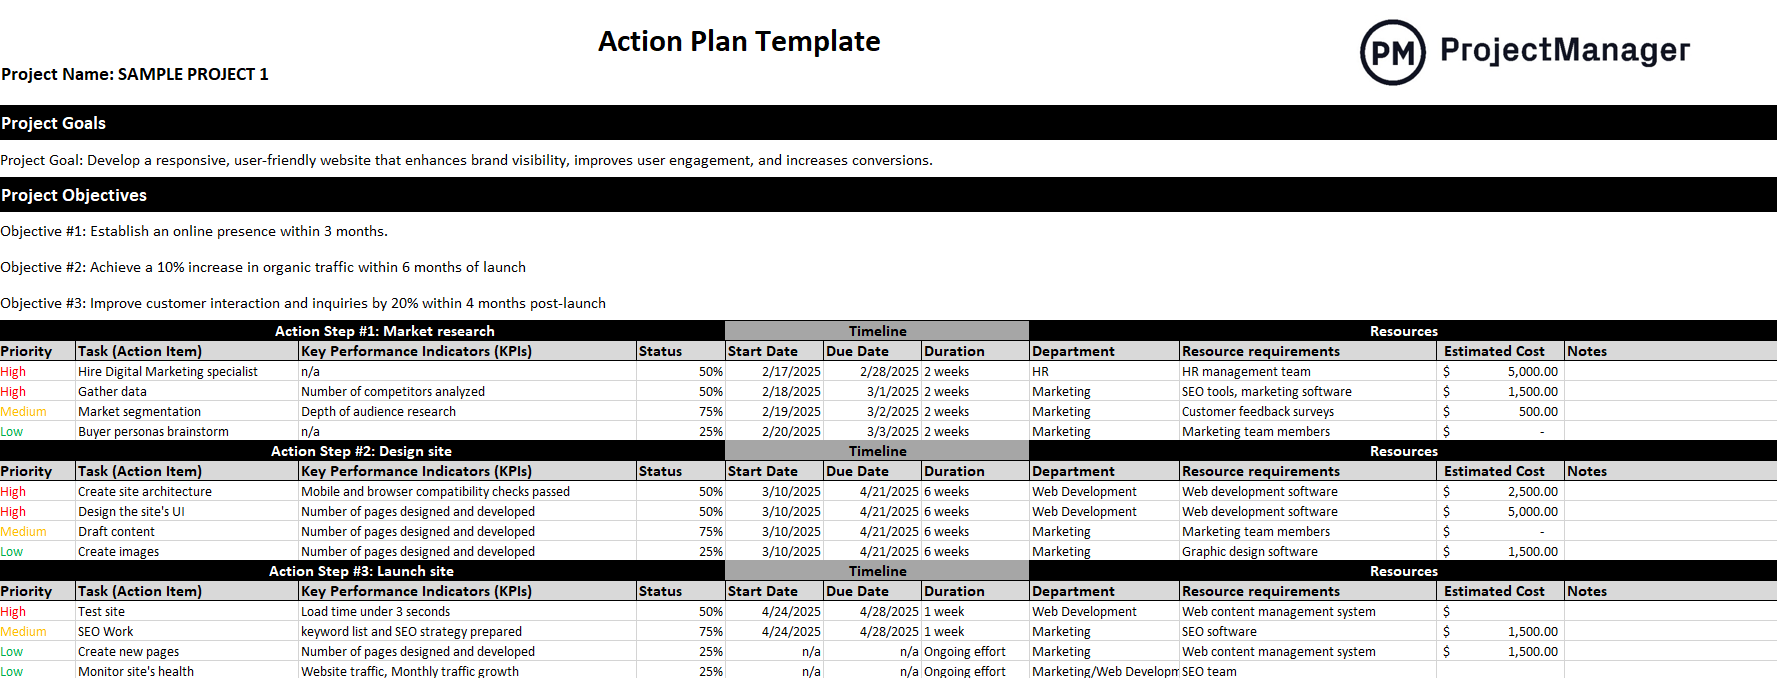
Unlike a Gantt chart, there is no visual representation of the project. There is a timeline, but it’s mapped out in columns that show the start and due dates as well as the duration of each task. This project plan example is not dissimilar to the Gantt chart, except that it lacks a bar chart.
6. Agile Project Plan Example
Working in an agile environment is not ideal for using a Gantt chart, as the tool is designed for waterfall methodology. However, agile projects use project management tools. The kanban board is ideal for working more iteratively.
One of the advantages of using a kanban board in an agile environment is that the scrum team can manage their backlog of user stories and collaborate as they plan the sprint. Meanwhile, the product owner and scrum master can view the board and spot any potential bottlenecks that will slow the team down. They can then reallocate resources as needed to clear up those issues.
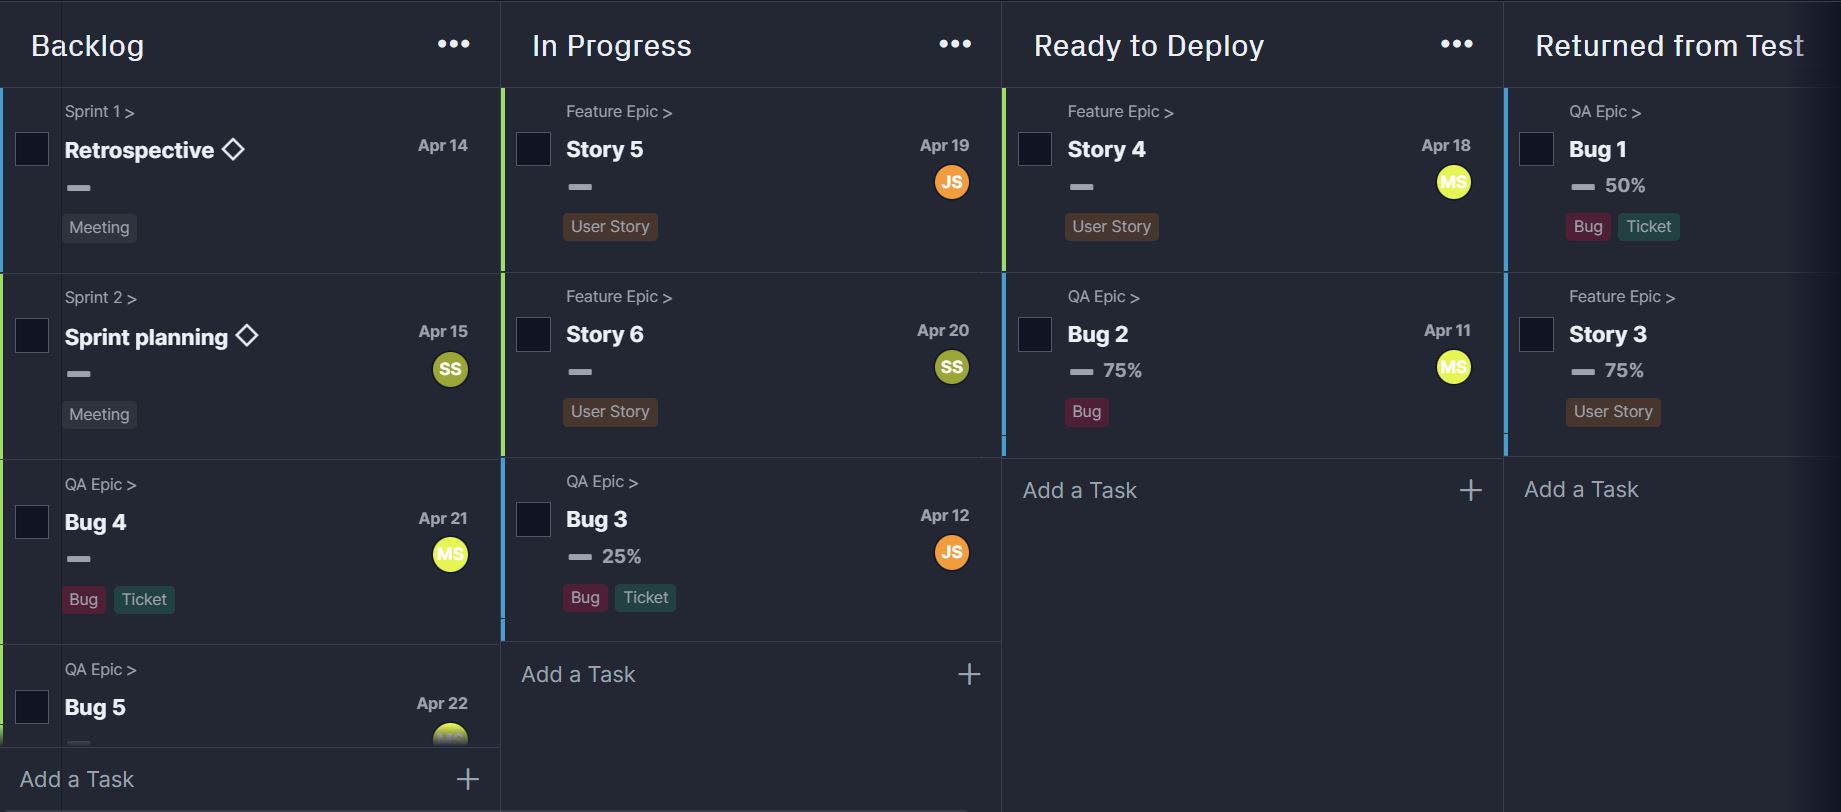
The kanban board is broken down into phases of production. For example, in this project plan example, there are columns for the backlog items, work that’s in progress, ready to deploy and those that have been tested and need work on bug fixes. Under each column are task cards that move from one column to the next as they work through the production cycle.
Word documents can also be used for a project plan, as illustrated below in this project plan example. This shows just a bit of an extensive outline for a project. Here one can see the project goals and objectives, an outline of the project teams, resource requirements, budget, timeline and risk log.
Planning a project involves coordinating many different things, from assembling human and nonhuman resources to accurately forecasting the budget and defining its goals and objectives. The benefit of a Word document is that it has the bandwidth to gather all this diverse data in one place, which will inform the project going forward.
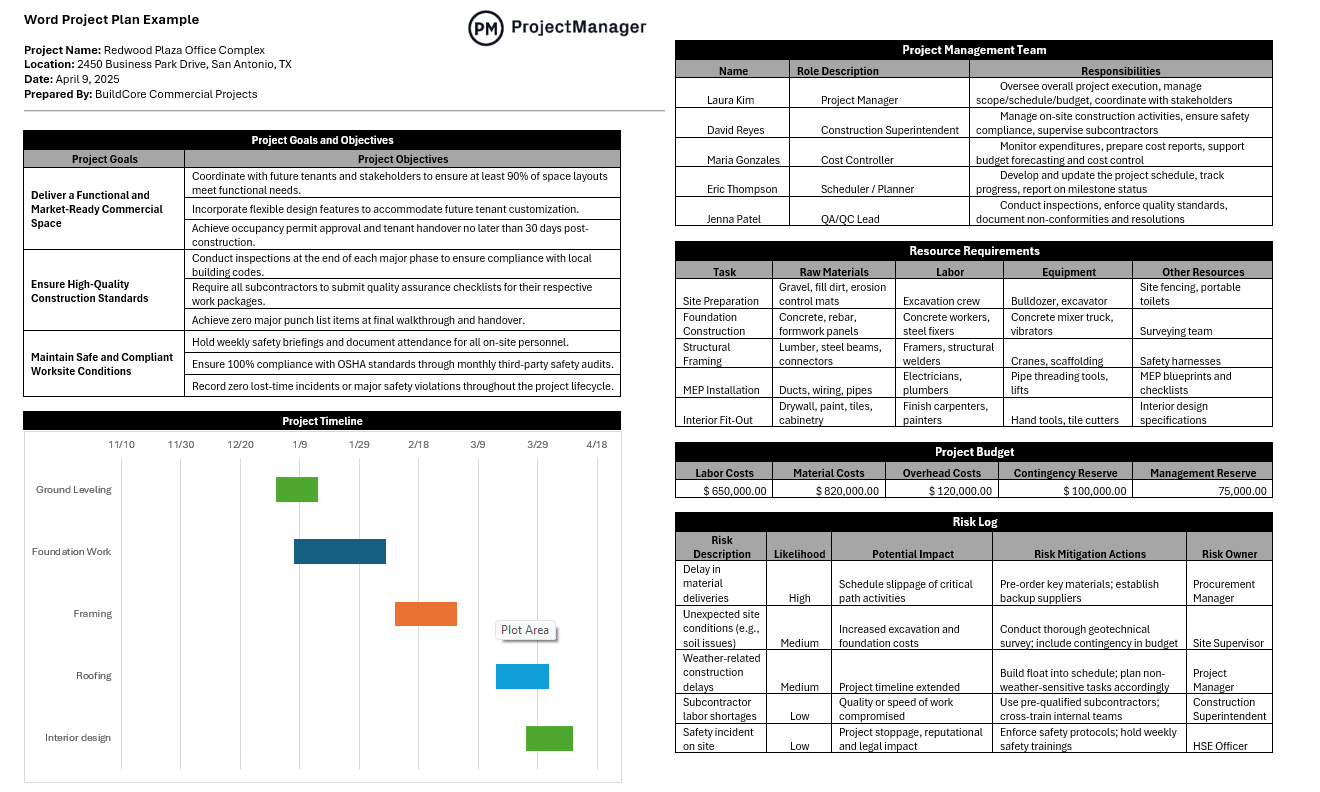
For example, each field outlined in the project plan example is filled out to make it easier for stakeholders to see what the project is all about. It also informs the project team to keep them on the same page, while fully understanding what is required to deliver the project successfully. The only problem with this project plan example in Word is that the whole thing will eventually have to be manually moved over to project management software.
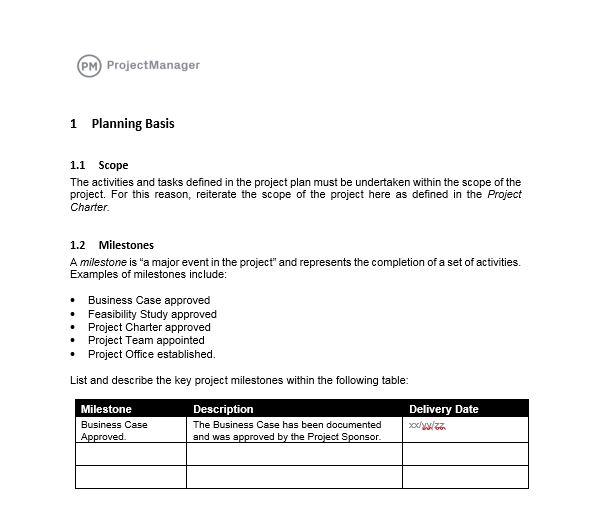
A project plan example is a sample document that outlines how a project will be executed, monitored and completed. It provides a clear structure for organizing tasks, timelines, resources and responsibilities.
This example is based on our free project plan template for Word and acts as a practical reference to help teams or project managers understand what to include in their plans, ensuring consistent and thorough project planning from the start.
Project Overview
The objective is to construct a 2,000 square foot single-family residential home on a cleared lot within 6 months, with a budget of $350,000. The home will include 3 bedrooms, 2 bathrooms, a kitchen, a living room and a garage. The project will follow a predictive life cycle with clearly defined phases.
Scope Management
The scope includes:
- Site preparation
- Foundation
- Framing
- Roofing
- Plumbing, electrical and HVAC systems
- Interior and exterior finishing
- Final inspection and occupancy certificate
Exclusions: Landscaping, fencing and furnishing are not included. Scope will be managed through a scope statement and WBS. Scope changes require formal approval.
Schedule Management
A Gantt chart will define all activities and dependencies. Major milestones include:
- Permits approved: Week 2
- Foundation completed: Week 6
- Framing completed: Week 10
- Final inspection: Week 24
Progress will be tracked weekly against the baseline using MS Project.
Cost Management
- Estimated cost: $350,000
- Contingency reserve: $15,000
The cost baseline will be tracked monthly, using actuals vs. planned. Variances over 5 percent will be escalated.
Quality Management
Quality standards include local building codes, structural safety and energy efficiency certifications. Inspections will occur at key stages: foundation, framing and final. Nonconformities will be documented and corrected before progressing.
Resource Management
Resources include the project manager, general contractor and subcontractors, construction crew and architect (on-call). Resources will be acquired through contracts. Labor availability will be reviewed during weekly planning.
Communications Management
Weekly site meetings with the contractor team. Monthly progress reports to the client (homeowner). Communication will be handled via email and shared folders. Stakeholder updates will follow the RACI matrix to ensure clear ownership.
Risk Management
Key risks include permit delays (mitigation: early submission and follow-up), material shortages (mitigation: early procurement) and weather delays (mitigation: build schedule buffer). A risk register will be updated biweekly and contingency plans will be triggered if thresholds are breached.
Procurement Management
Major procurements include materials (lumber, concrete, fixtures) and subcontracted services (plumbing, electrical, HVAC). Contracts will be fixed-price where possible. Procurement will follow the company procurement policy and include vendor evaluation.
Stakeholder Management
Key stakeholders are the homeowner (sponsor), architect, general contractor and local building inspector. Engagement strategies involve the homeowner in design and finish selections and keeping the city inspector informed of inspection timelines
Change Management
All change requests must be submitted to the project manager in writing. The impact will be evaluated for scope, schedule and cost. Approved changes will be reflected in the updated baselines.
Performance Measurement Baseline
Integrated baseline includes the scope baseline (WBS), schedule baseline (approved Gantt chart) and cost baseline ($350,000). Earned Value Management (EVM) will be used at monthly checkpoints: Planned Value (PV), Earned Value (EV), Actual Cost (AC) and Variance analysis (SV, CV)
Related Project Planning Templates
It’s one thing to look at project plan examples, it’s another thing to do one. We have over 100 free project management templates for Excel and Word that cover all aspects of managing a project. Below are a few that can help interested parties play around with creating their project plan.
Resource Plan Template
Download this free resource plan template for Excel to plan, manage and execute project resources. Human resources are listed by team member, department, total effort, rate and cost. There’s also a calendar attached to schedule resources to ensure that the project has what it needs when it needs it.
Gantt Chart Template
Use this free Gantt chart template for Excel to view tasks, milestones and deadlines. It helps project managers and teams outline the project’s schedule by mapping activities along a horizontal time axis, showing when each task starts, how long it will last and when it will end.
Project Budget Template
A project budget template is a structured financial planning tool that helps project managers estimate, allocate and track the costs associated with completing a project. This project budget template for Excel provides a framework for organizing budget items, such as labor, materials, equipment and overhead, into a clear and manageable format.
How ProjectManager Helps Manage Projects
A project plan sets the stage for a successful project, but it’s only the beginning. While one can plan out the project on templates, it’s not advisable because then, the project plan is isolated on a static document. There’s no way to collaborate and any changes must be manually made. When managing a project, it’s important to work efficiently, which is why professionals choose project management software.
ProjectManager is award-winning project and portfolio management software with powerful Gantt charts to plan out work and multiple project views that give teams the tools they need to execute that work, be it on kanban boards or task lists. There’s even a calendar view that stakeholders can use to stay updated on progress.
Keep Productive With Robust Resource Features
Missing from our project plan examples is the execution of the project. At that point, project managers are working to keep the project on track. One way to do that is by effectively delivering resources. This starts on the Gantt chart, which schedules them, and continues when onboarding teams, where their availability can be set. This helps to assign the right resources to the right tasks at the right time.
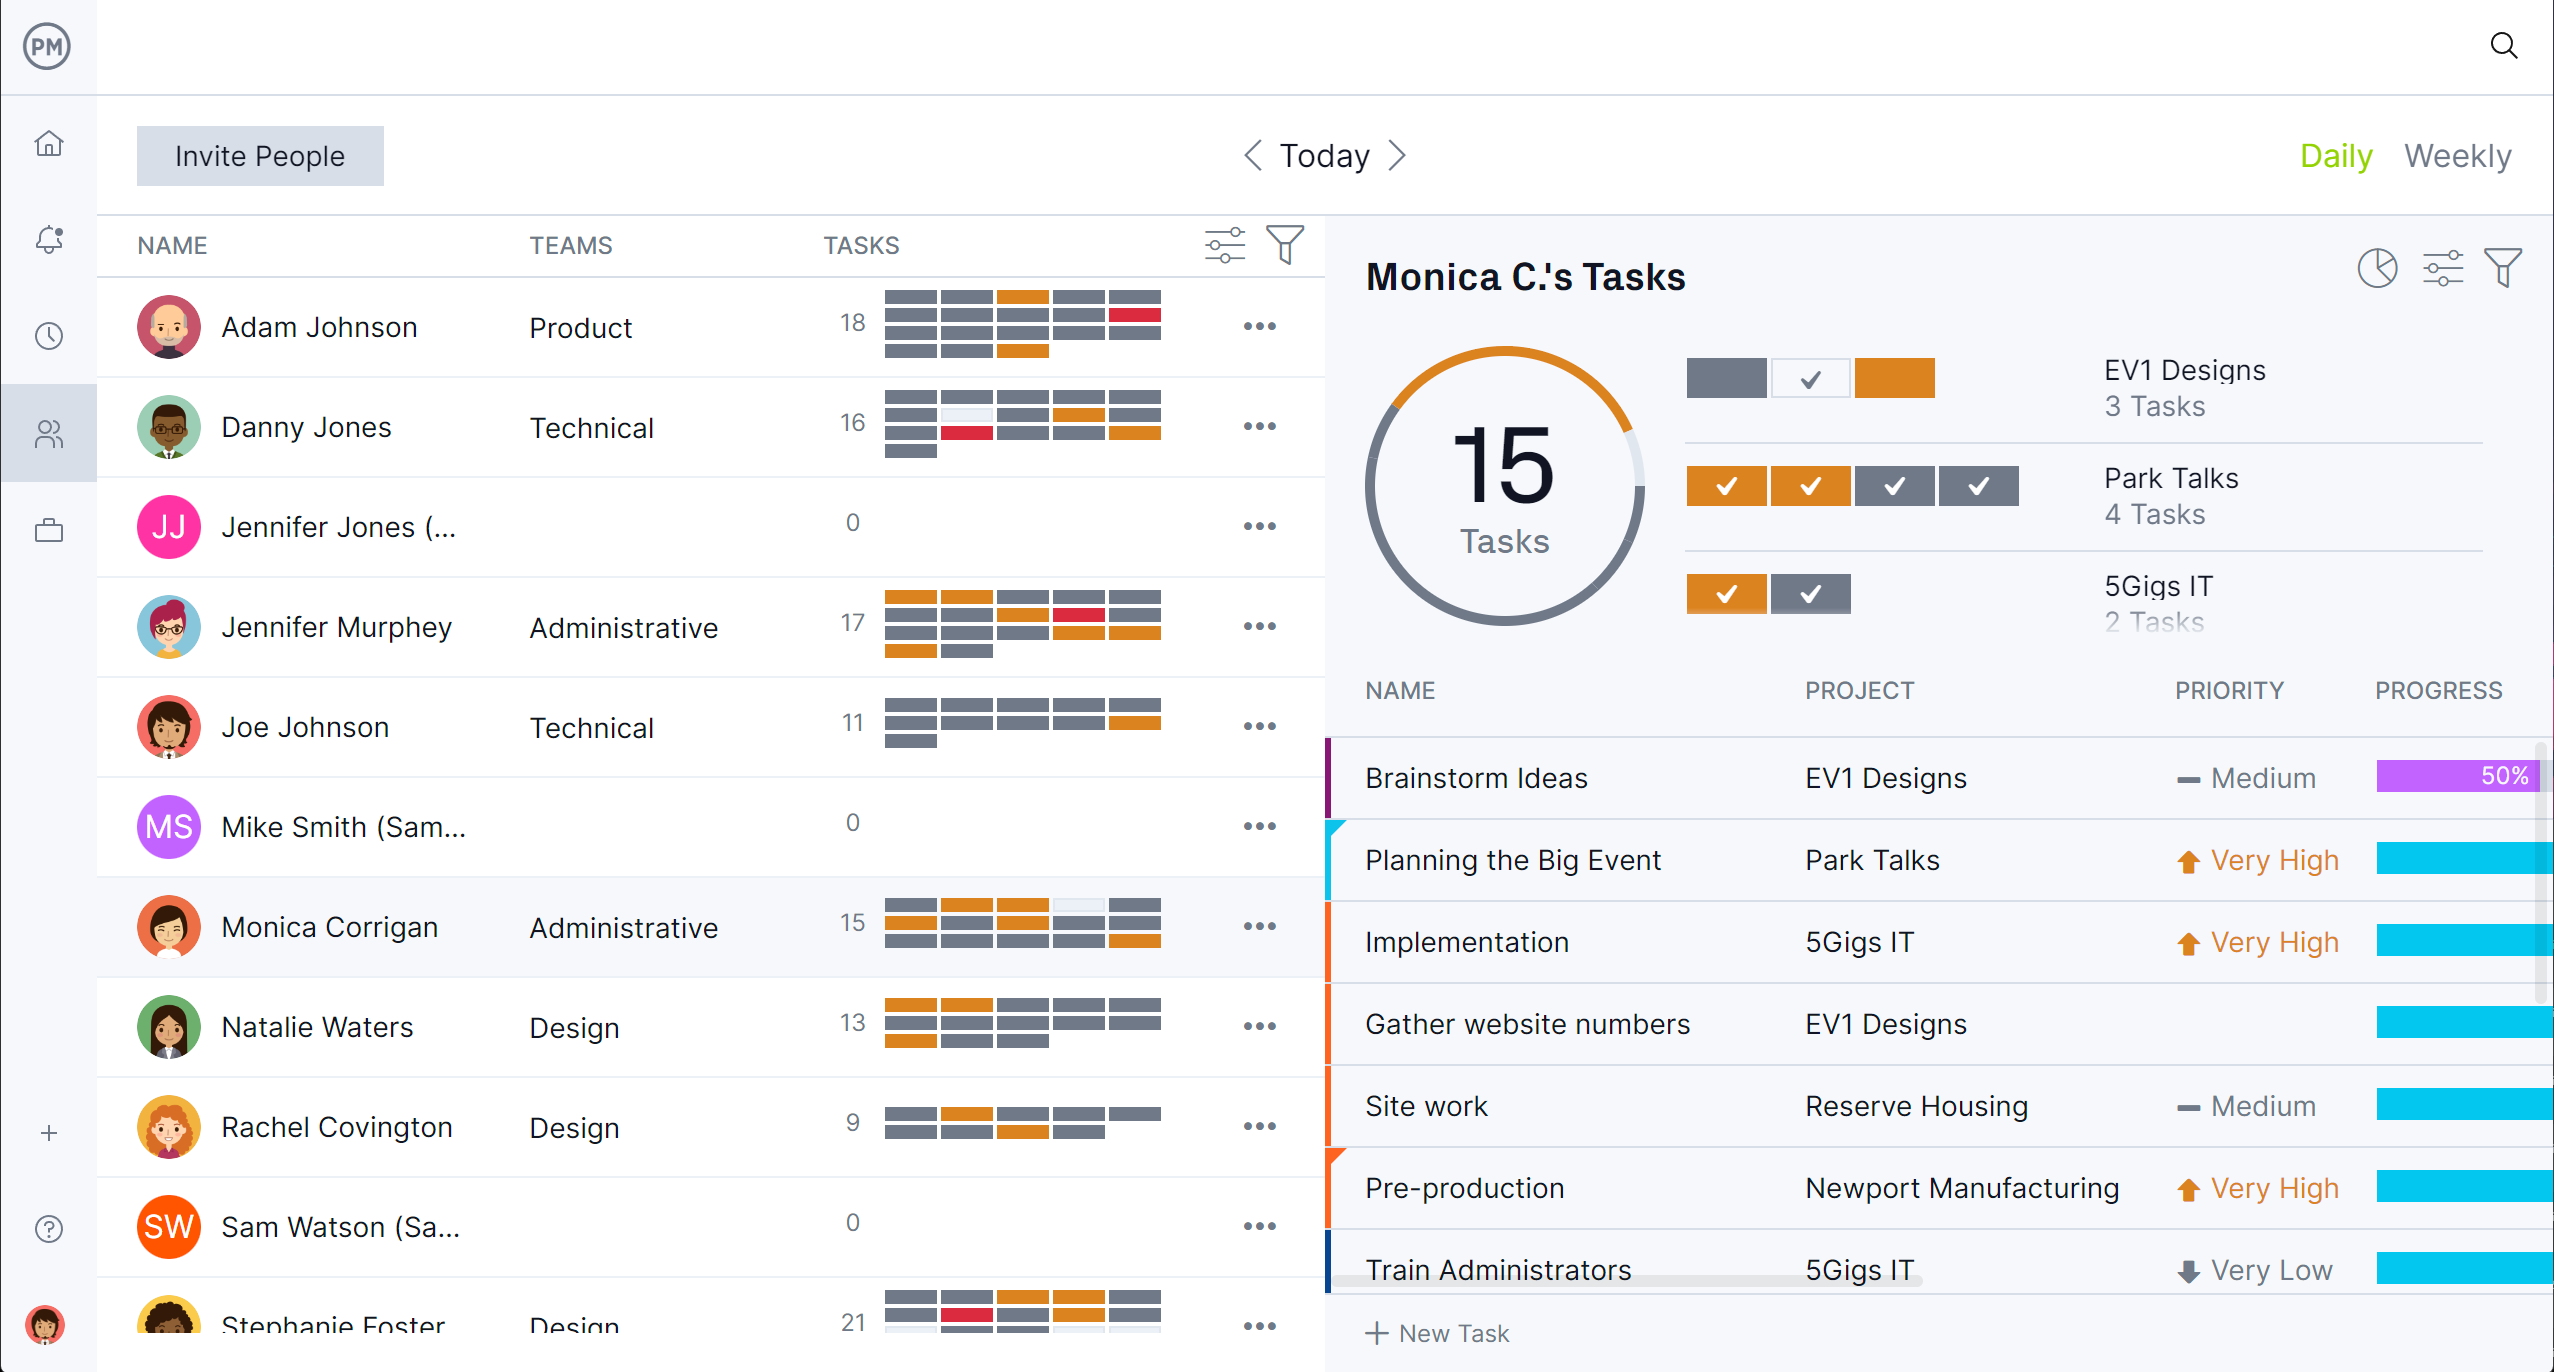
A color-coded workload chart makes it easy to view resource allocation across one or multiple projects and balance the team’s workload to keep them working at capacity but not burning them out. A team page provides a real-time daily or weekly summary of their tasks, which can be filtered by priority or progress. Tasks can even be updated without leaving the page.
Monitor Project Metrics on Real-time Dashboards and Reports
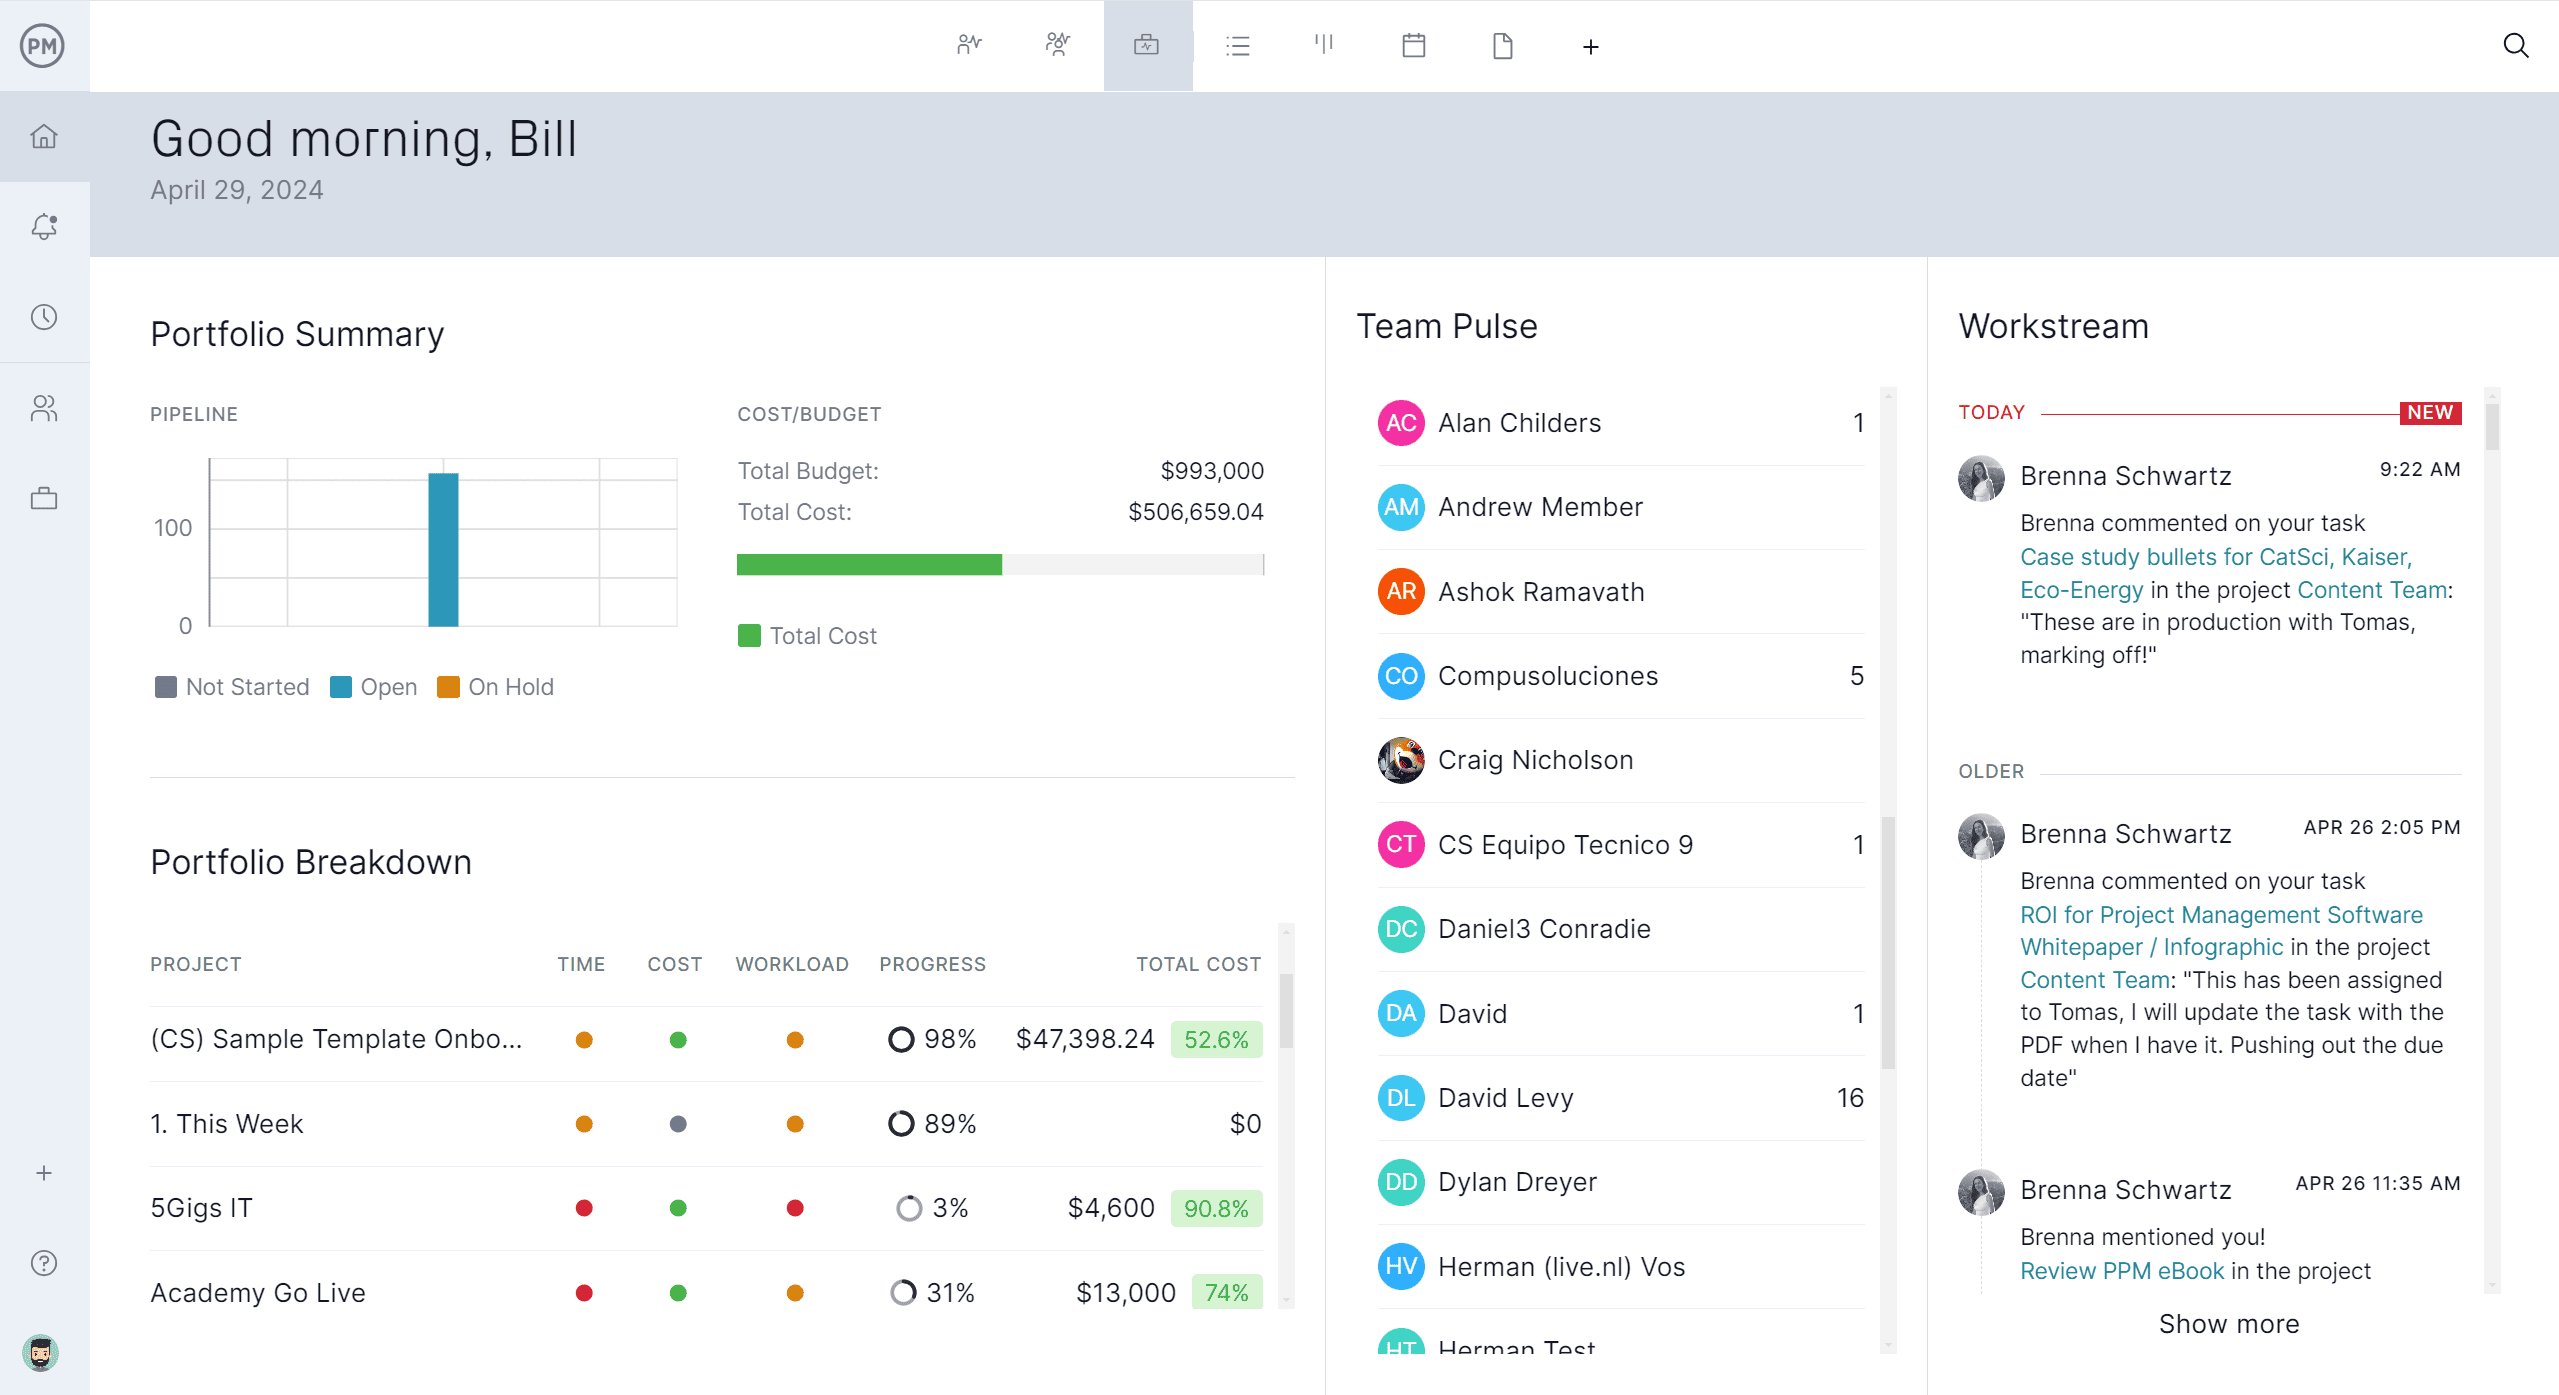
Another way to keep to the project plan is by monitoring and controlling the project during its execution. For a high-level overview of key performance indicators (KPIs), toggle to our dashboards that capture live data on time, cost, workload and more on easy-to-read graphs and charts. For example, the portfolio summary dashboard is pictured below.
To get deeper into the data, visit our customizable reports on status, variance, workload, timesheets and more. Each can be filtered to focus on specific data points or show a summary of progress that can be shared with stakeholders. Secure timesheets streamline the payroll process, but also help keep projects on budget by tracking labor costs.
Related Project Planning Content
While there’s more to project management than the project plan examples we’ve shared, there’s also more to project planning. For those interested in going deeper into the subject, below are links to various related blogs we’ve recently posted.
ProjectManager is award-winning project and portfolio management software that connects teams whether they’re in the office or out in the field. They can share files, comment at the task level and stay updated with email and in-app notifications. Join teams at Avis, Nestle and Siemens who use our software to deliver successful projects. Get started with ProjectManager today for free.


