

Gantt charts are one of the most versatile project management tools there are as they can help plan, schedule and track projects. However, not all Gantt chart software has the features needed. That’s why we’ve reviewed some of the best Gantt chart software alternatives to help make a more informed decision.
In this blog, we’ll go over the key features and pros and cons of a Canva Gantt chart, as well as some alternatives that can be used instead.
What Is Canva?
Canva is an online graphic design tool that allows users to edit images and videos for creative briefs, presentations, websites and many other creative projects. For example, it can help design printed products, make a logo for a business or create social media content.
The software uses a drag-and-drop interface to make the design process easier. Since its introduction in 2013, Canva has added services such as a print product platform and video editing tool. It has a free model, but users can unlock premium features and upgrade to Canva Pro for professional design tools.
This has made Canva one of the most popular graphic design tools used by creative business owners. It’s simple enough to use that beginners can make a quick graphic on a collaborative platform. The web-based tool has regular updates and additions that are constantly improving its functionality.
Does Canva Have a Gantt Chart?
Gantt charts are foundational tools for managing work. While Canva focuses on graphic design and offering users a simple and effective way to make quick designs, it falls short on project management. It relies on the graphic creation of presentations and other visual tools. However, it falls short when managing those projects with essential tools, such as Gantt charts.
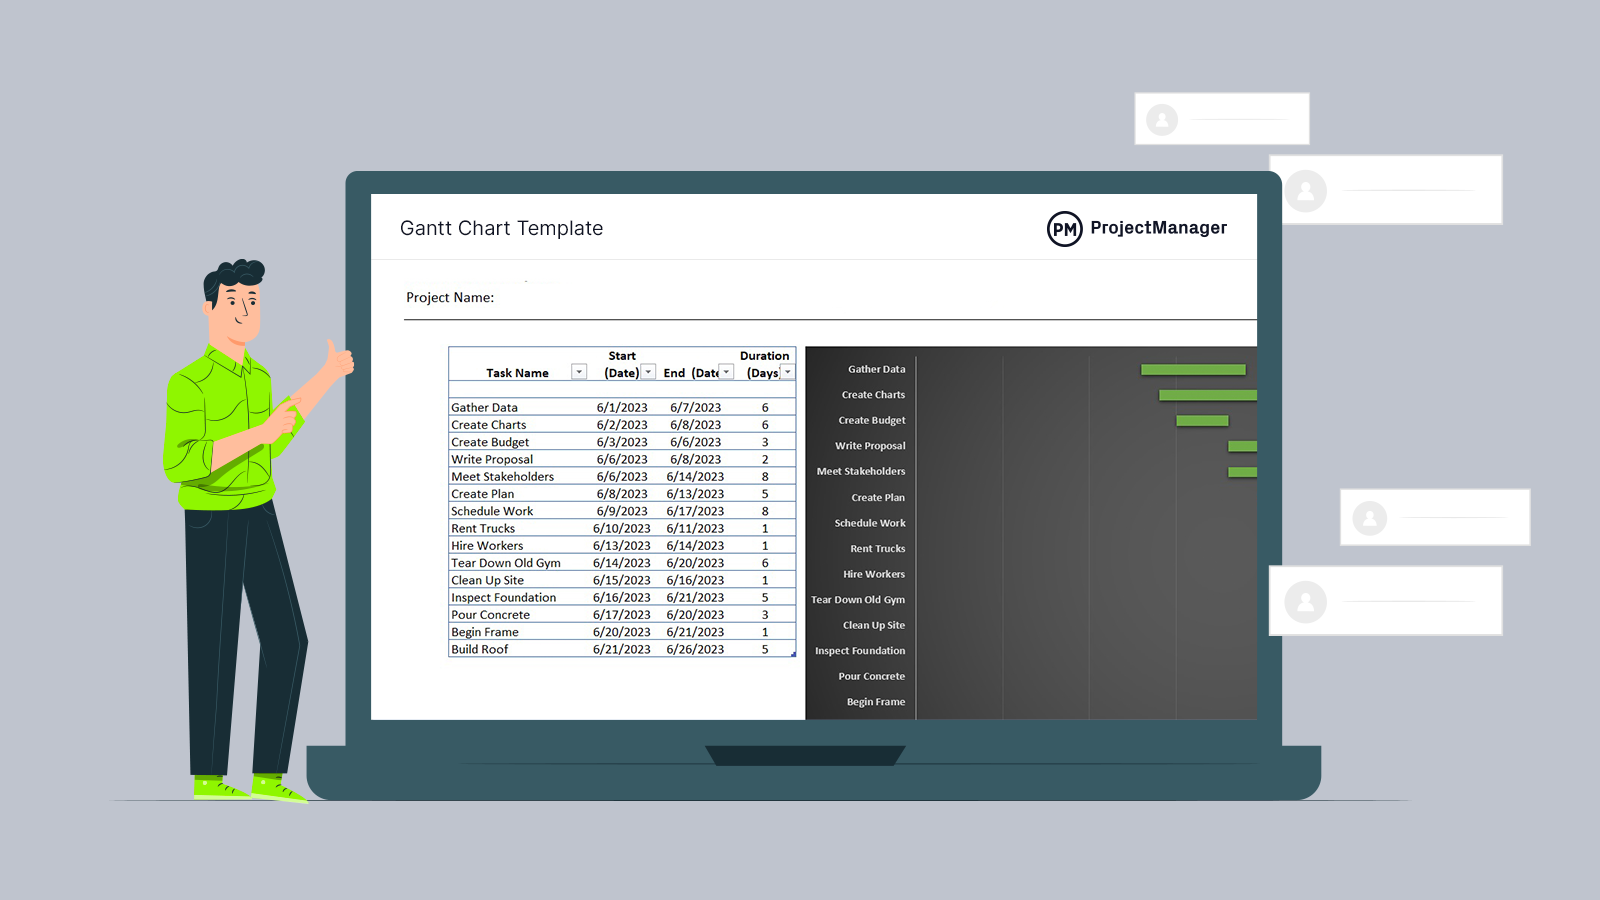
Gantt charts are made up of two parts. On the left is a spreadsheet that lists all the project tasks, their duration and related costs and resources. On the right, this data is populated on a visual timeline that shows the entire project on one page. Gantt charts can then plot milestones, link dependencies and more, giving managers greater control when planning, managing and tracking projects.
Related: Best Gantt Chart Software Rankings
Canva has templates and design tools that can mimic a Gantt chart, but lack the features that project managers need to ensure their projects are delivered on time and within budget. Design apps like Canva aren’t built for that sort of work.
Short Answer: Yes, Canva Has a Gantt Chart
Canva doesn’t have a built-in Gantt chart feature but has free and paid productivity and document editing tools such as tables, graphs and charts that can be used to make a basic Gantt chart. To do so, export the Canva Gantt chart as an image or PDF format and attach it to a project documentation or presentation slides.
Long Answer: Canva’s Gantt Chart Lacks Key Features for Project Management
Canva has Gantt chart templates to list tasks and edit timelines and bars. These Gantt chart templates can also add details, such as milestones and assignees. But because Canva relies so heavily on templates there is limited customization. This restricts creative freedom and, more importantly, limits the value of using a real, robust Gantt chart.
Not using a real Gantt chart could mean the difference between a successful project and a failure. Don’t take that risk. ProjectManager is award-winning project and portfolio management software with powerful Gantt charts that are easy to use. They can do everything a normal Gantt chart can do, such as organizing tasks, resources and costs, but go beyond the basics. Users can link all four types of task dependencies to avoid costly delays, filter for the critical path to identify essential tasks and set a baseline to track planned effort against actual effort in real time to stay on schedule and keep to the project budget. Get started with ProjectManager today for free.
Canva Gantt Chart Features
As previously mentioned, Canva allows users to assemble a basic, visual approximation of a Gantt chart using Canva’s graphic-design elements. While this can produce a simple timeline illustration, it lacks the functionality, automation and data-driven capabilities of a true Gantt chart found in project management software.
- Tables to structure task names and time periods.
- Rectangles and shape elements to represent task bars.
- Drag-and-drop resizing to visually adjust bar lengths.
- Color fills to differentiate phases or task categories.
- Text boxes for task names, dates and labels.
- Line and arrow elements to illustrate dependencies visually.
- Grid and alignment tools to create cleaner layouts.
- Templates that can serve as a starting point for timeline-style designs.
What Project Management Features Is Canva Gantt Chart Missing?
Because Canva is not a project management platform, its makeshift Gantt charts do not include any real project management features. It cannot calculate schedules, track progress, manage resources or monitor budgets. Canva can only display graphics—the operational and analytical capabilities required for managing projects simply do not exist in the tool.
- Canva provides no features for managing team capacity or assigning resources, so workload distribution and utilization analysis aren’t possible.
- There’s no logic engine for identifying the critical path—Canva cannot calculate FS, SS, FF or SF task dependencies.
- Financial oversight tools are absent; you can’t track project costs, compare planned vs actual spending or build budget variance reports.
- Baseline creation isn’t supported, meaning there’s no way to freeze an original plan or measure schedule or cost deviations over time.
- Milestones can only be drawn manually; Canva doesn’t support date-driven milestone mapping or automatic milestone updates.
- Progress tracking isn’t built in—you can’t update percent complete, monitor task health or generate status summaries.
- Task relationships aren’t functional; while you can sketch dependencies visually, Canva cannot enforce or update them in response to schedule changes.
- Canva offers no alternative project views—features like kanban boards, dashboards, timeline views or task lists simply don’t exist.
How to Make a Canva Gantt Chart Better With ProjectManager
Don’t let Canva keep the power of a Gantt chart beyond reach. Get a fully functional Gantt chart that can do much more than the bare-bones ones users make in Canva. Follow these steps to create a better Gantt chart in ProjectManager.
Before we dive into the process let’s quickly go over a side-by-side comparison of ProjectManager’s Gantt chart and Canva’s Gantt chart.
| Canva Gantt Chart | ProjectManager Gantt Chart |
| No real task dependencies — only drawn manually (not functional) ❌ | Four fully functional task dependencies (FS, SS, FF, SF) ✅ |
| No auto-shift behavior — moving a bar does nothing ❌ | Automatic cascading updates for all linked tasks ✅ |
| Milestones can only be drawn as shapes ❌ | Built-in milestones, subtasks and hierarchy tools for accurate scheduling ✅ |
| No ability to set or compare baselines ❌ | Full baseline tracking and schedule/cost variance reporting ✅ |
| Single static visual — no true multi-project view ❌ | Supports portfolio-level Gantt charts and multi-project roadmapping ✅ |
| No cost, budget or planned-vs-actual tracking ❌ | Tracks estimated vs. actual costs with real-time budget reporting ✅ |
| No resource workload, allocation or utilization tools ❌ | Resource allocation, workload monitoring and utilization charts built in ✅ |
| No percent-complete tracking — everything must be drawn manually ❌ | Percent-complete column with automatic sync to dashboards and reports ✅ |
| No task prioritization or task-level metadata ❌ | Priority fields, custom columns and full task-level detail panels ✅ |
| Only visual “sections” if manually drawn ❌ | Supports full Work Breakdown Structure (WBS) hierarchy ✅ |
| No column customization — it’s just graphics ❌ | Fully customizable columns for tasks, dates, costs, resources and more ✅ |
| Exports are limited to static images of your design ❌ | Exports to PDF, Excel and images with structured project data included ✅ |
| Manual drag-and-drop of shapes (no actual scheduling logic) ❌ | Advanced drag-and-drop task scheduling with real-time recalculations ✅ |
| No planned vs. actual duration tracking ❌ | Tracks planned vs. actual hours automatically for schedule accuracy ✅ |
| Only basic templates for timelines, none for real Gantt charts ❌ | Ready-made Gantt chart templates for multiple industries and use cases ✅ |
1. Start a Free Trial
Take a free trial with ProjectManager. There’s no credit card info needed. Once signed up, users have 30 days to kick the tires and explore the features of ProjectManager. There are Gantt charts, of course, but also task and resource management features, risk management tools and real-time dashboards and customizable reports to monitor and control projects to deliver them successfully.
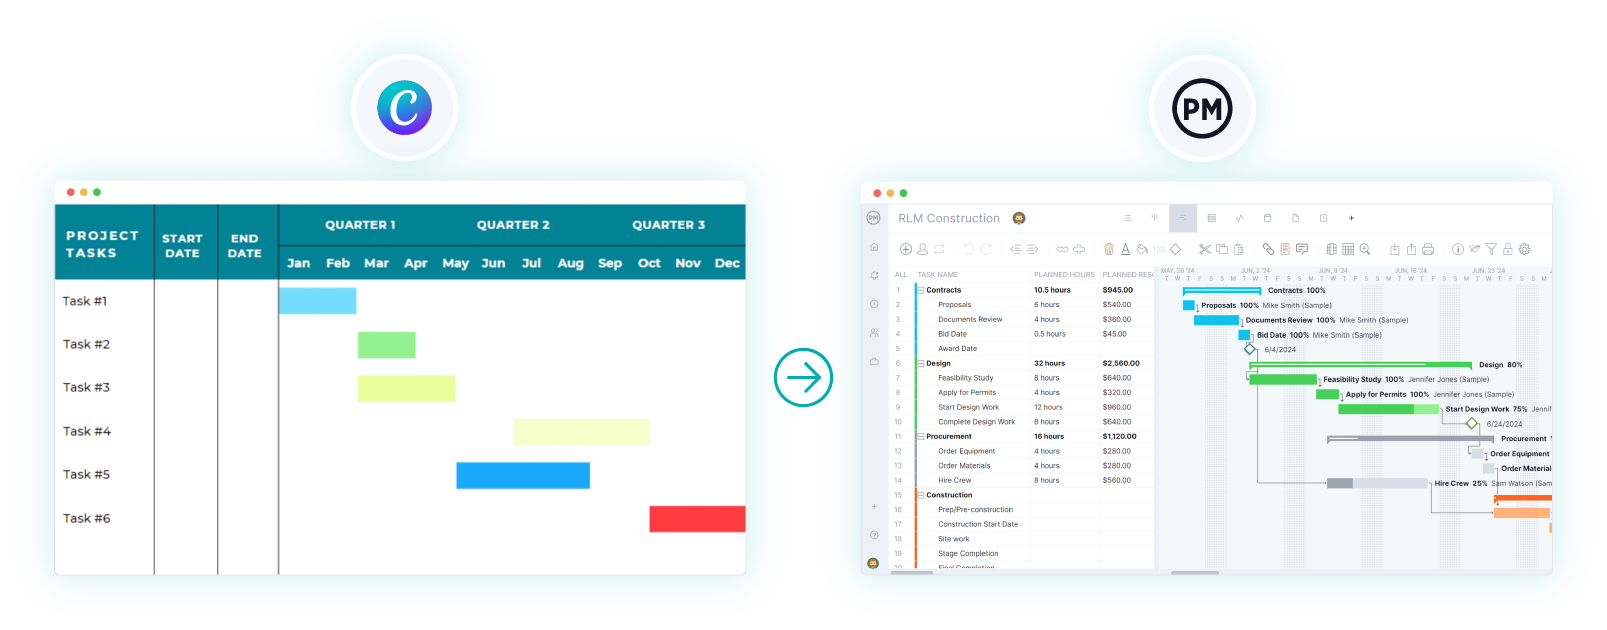
2. Import Project Tasks Into ProjectManager
Instead of manually adding tasks into Canva, you can instantly import several columns of project data from existing Excel spreadsheets, CSV files or even Microsoft Project files.
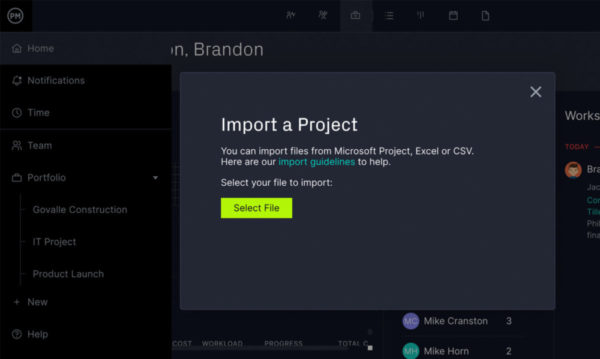
3. Select Options
Now, decide if this will be a new project or if it should be added to an existing project. If it’s new, name it, and if it’s being added to a project, note whether to keep or delete the existing data.
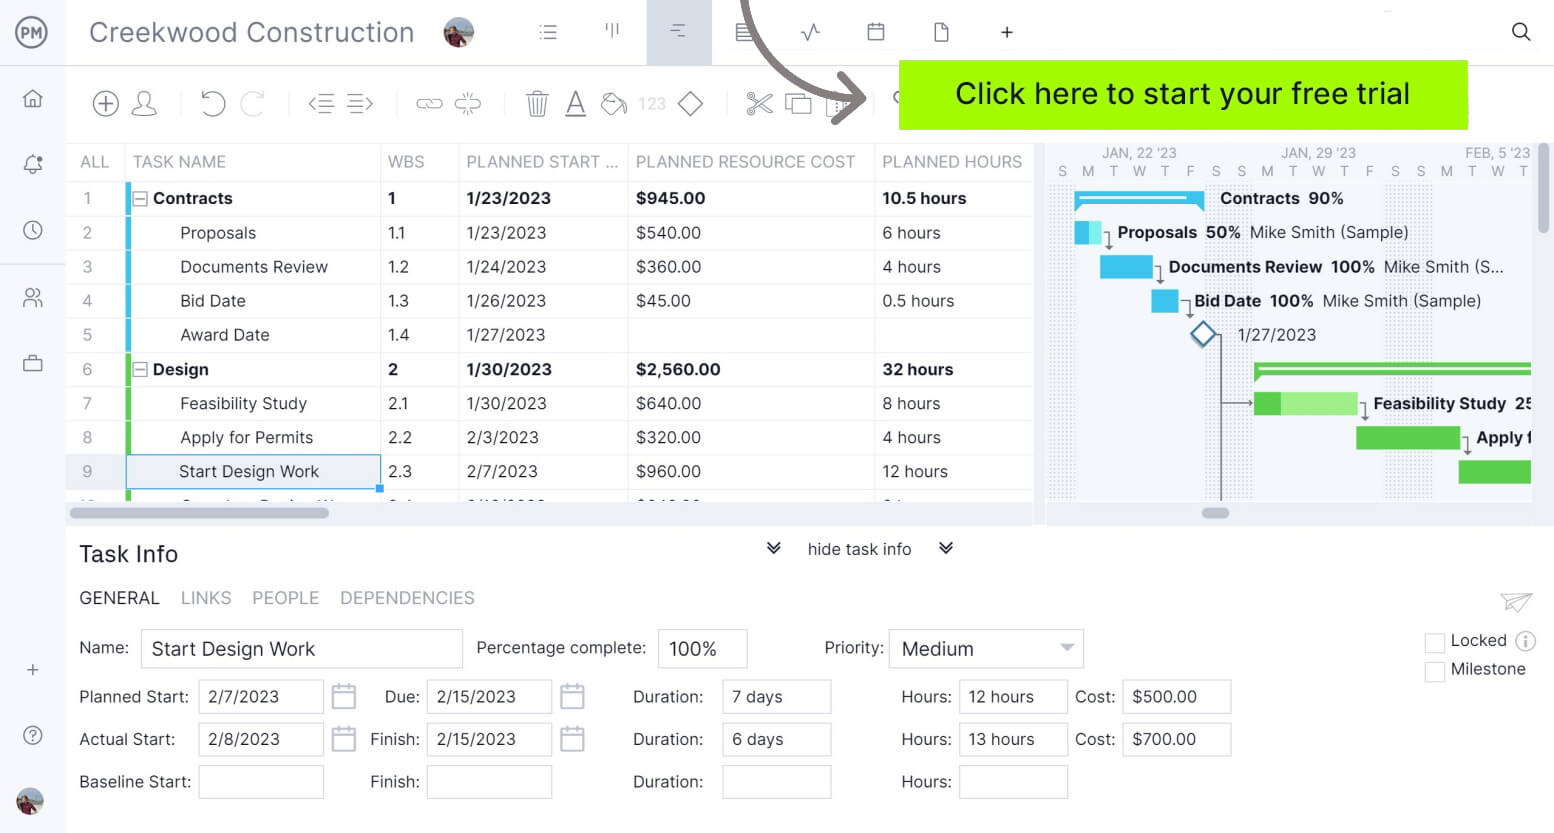
4. Create a Robust ProjectManager Gantt Chart with More Features Than a Canva Gantt Chart
A popup window will say, “Success!” showing that the project has been imported. It’s now a real Gantt chart in ProjectManager. Look around and see what our Gantt chart can do. It’s packed with features, can be shared with the team and also links to the other project views (kanban boards, task lists, calendars, etc.) and informs other features, such as the dashboard, reports and workload chart.
Get your free
Gantt Chart Template
Use this free Gantt Chart Template to manage your projects better.
Canva Gantt Chart Pricing
Canva does not include a built-in Gantt chart in any of its pricing plans. All versions only allow a manually designed, static timeline using shapes, tables or stacked bar-style graphics. However, chart availability varies by plan—some advanced chart types and customization features are only included in paid tiers.
- Free ($0): No built-in Gantt chart. Limited access to chart types; some advanced charts and customizations are locked behind paid plans.
- Pro ($14.99/user/month): No built-in Gantt chart. Full access to Canva’s chart library, including stacked bar charts and additional customization tools.
- Teams ($29.99/user/month): No built-in Gantt chart. Includes all Pro chart features plus enhanced collaboration and asset management.
- Enterprise (custom pricing): No built-in Gantt chart. Offers admin and brand controls; chart functionality remains the same as Pro.
ProjectManager’s Gantt Chart Does More Than a Canva Gantt Ever Could
Now it’s time to look at ProjectManager’s Gantt chart and see what it can do. There’s no reason to ever go back to Canva because our Gantt chart seamlessly integrates with the rest of our project tools. That means users can track time and costs, balance workload and much more.
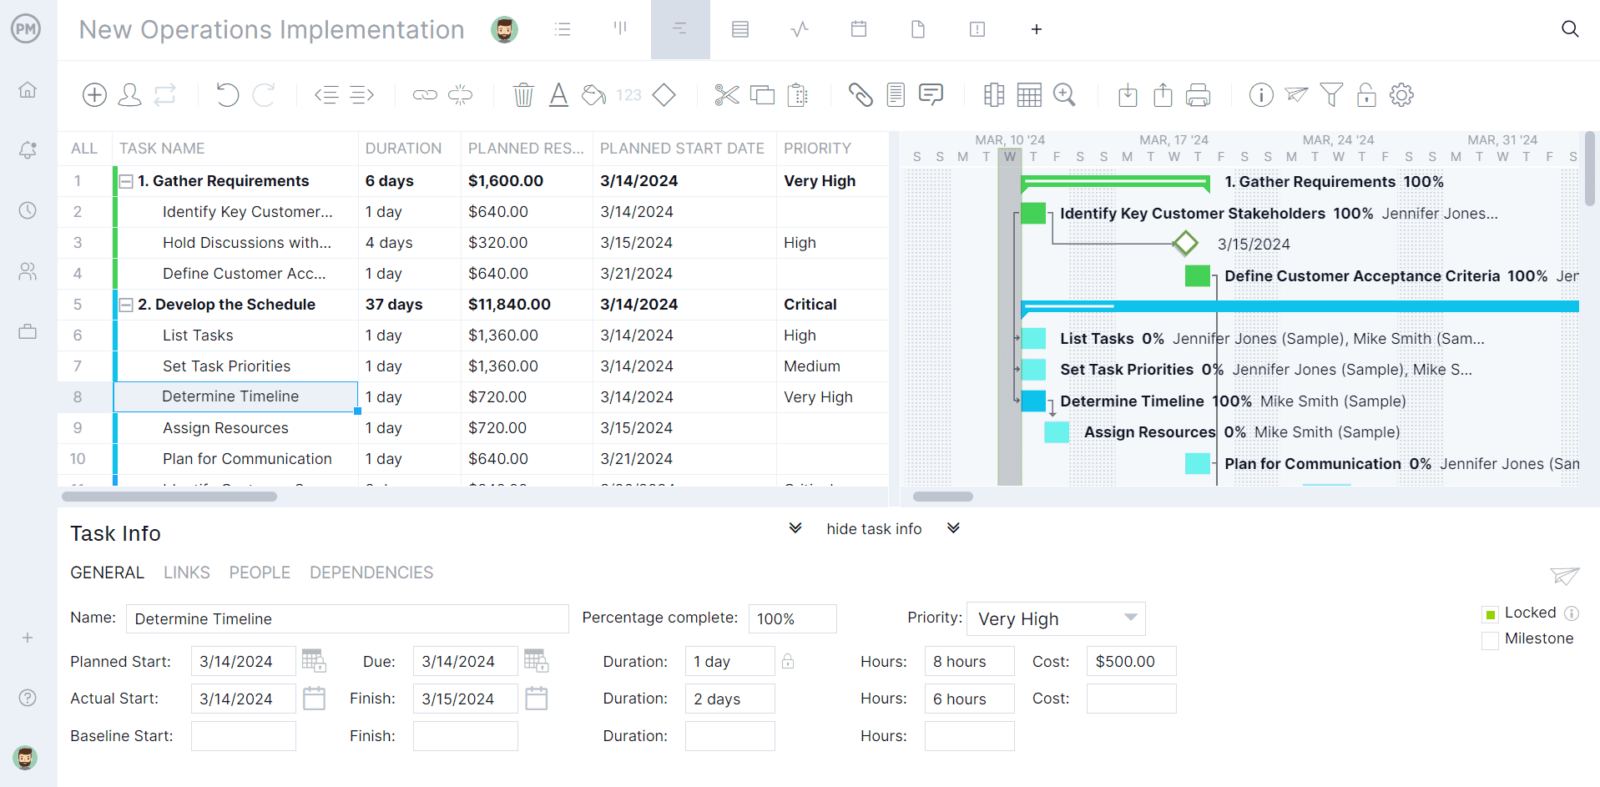
Set Milestones & Track Baselines
Milestones are represented by diamond icons. They are used to indicate important project dates, such as the end of one phase and the beginning of another. They can help track progress, but for a more powerful tracking tool, set a baseline. Once the baseline is captured on the Gantt chart, users get real-time data on how the project is doing. They can see planned costs against actual costs and planned progress against actual progress in real time to help deliver the project successfully. Plus, it’s easy to filter for the critical path. There are no time-consuming and complicated calculations needed. Try that on Canva.
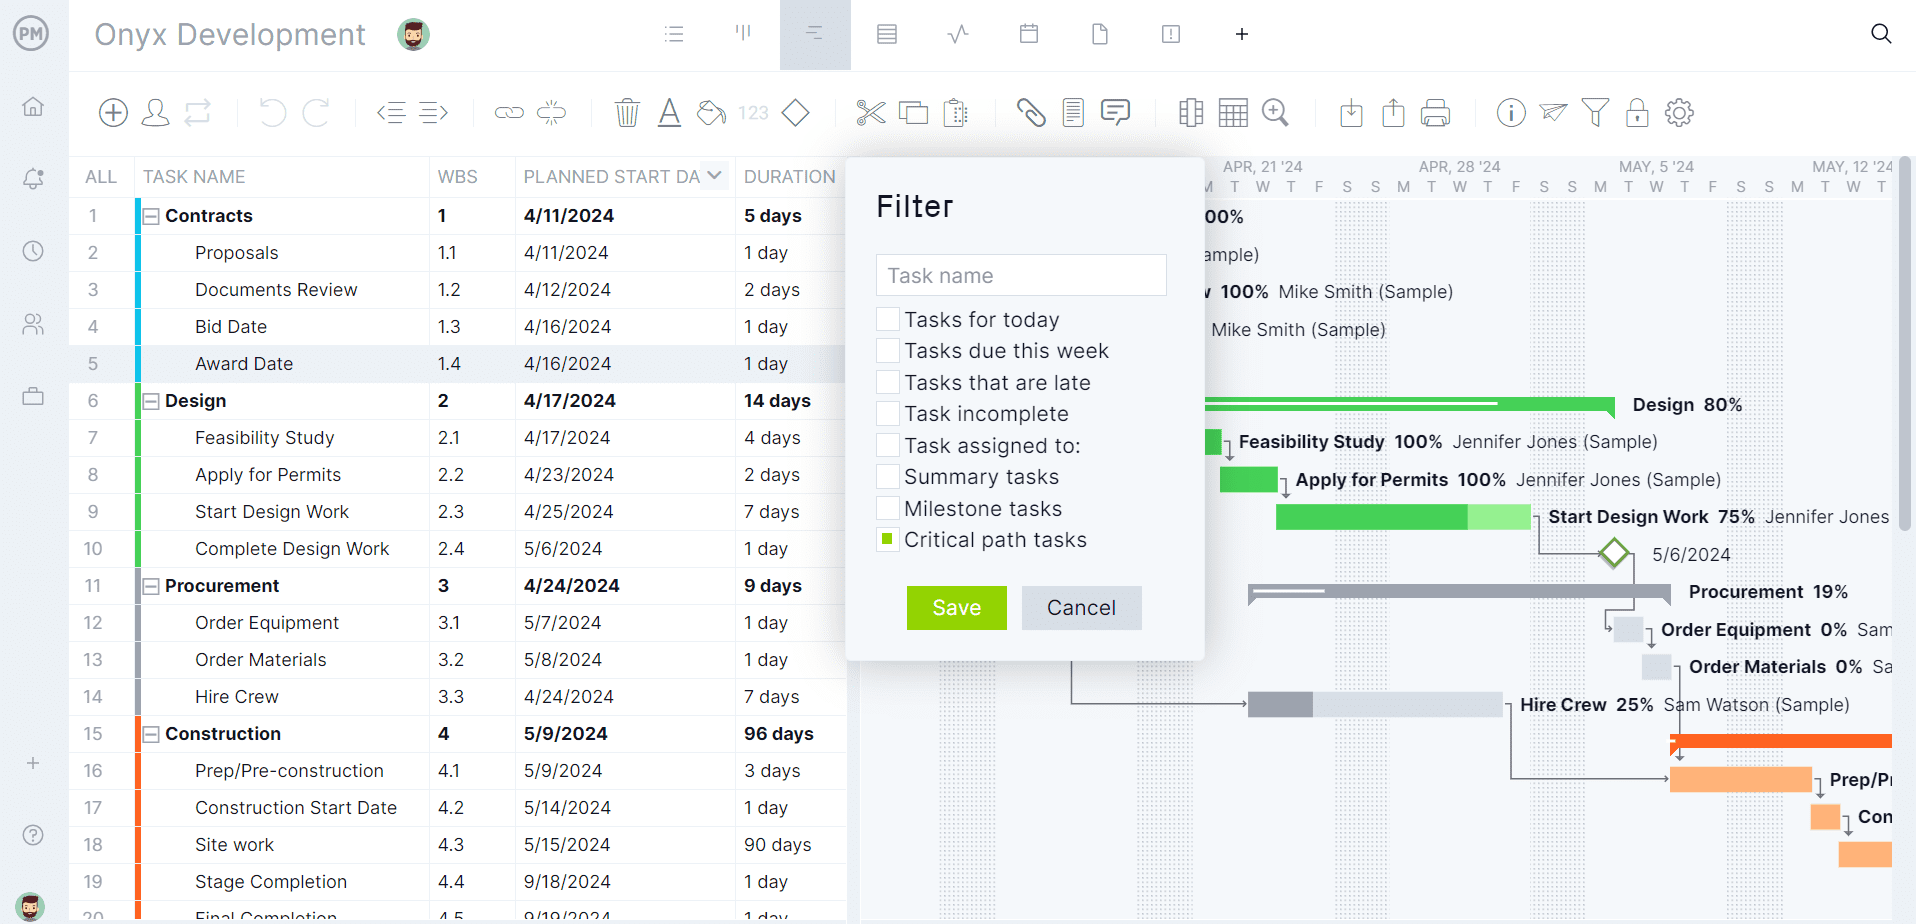
Filter by Priority, Dependencies & More
The Gantt chart can be filtered in any number of ways to allow project managers to focus on the information they want to see. For example, they can filter by priority to ensure those tasks are being executed in a timely fashion. It’s also possible to filter by dependencies to avoid delays. Canva can’t do that. A big difference between Canva and ProjectManager is that users can link all four types of task dependencies. There are also customized tags to make tasks easier to find. It’s easy to assign team members to tasks, see their availability and better manage resources.

What Can You Use a Canva Gantt Chart For?
Canva Gantt charts are simplistic and only allow for basic task management and scheduling. Users can plan and schedule project tasks, track their progress on timelines and visualize the project in one place. While these Gantt charts can be helpful in specific situations, they aren’t nearly as powerful as project management software.
How to Create a Canva Gantt Chart
If you’re still curious about how to make a Canva Gantt chart, we’ve outlined what you should know. There are two main methods for making a Gantt chart in Canva. Use a free or paid Canva Gantt chart template or make one from scratch. Here’s a quick overview of both of these approaches.
Use a Canva Gantt Chart Template
Using a template is the easiest way to make a Gantt chart in Canva.
1. Choose a Gantt Chart Template From Canva’s Library
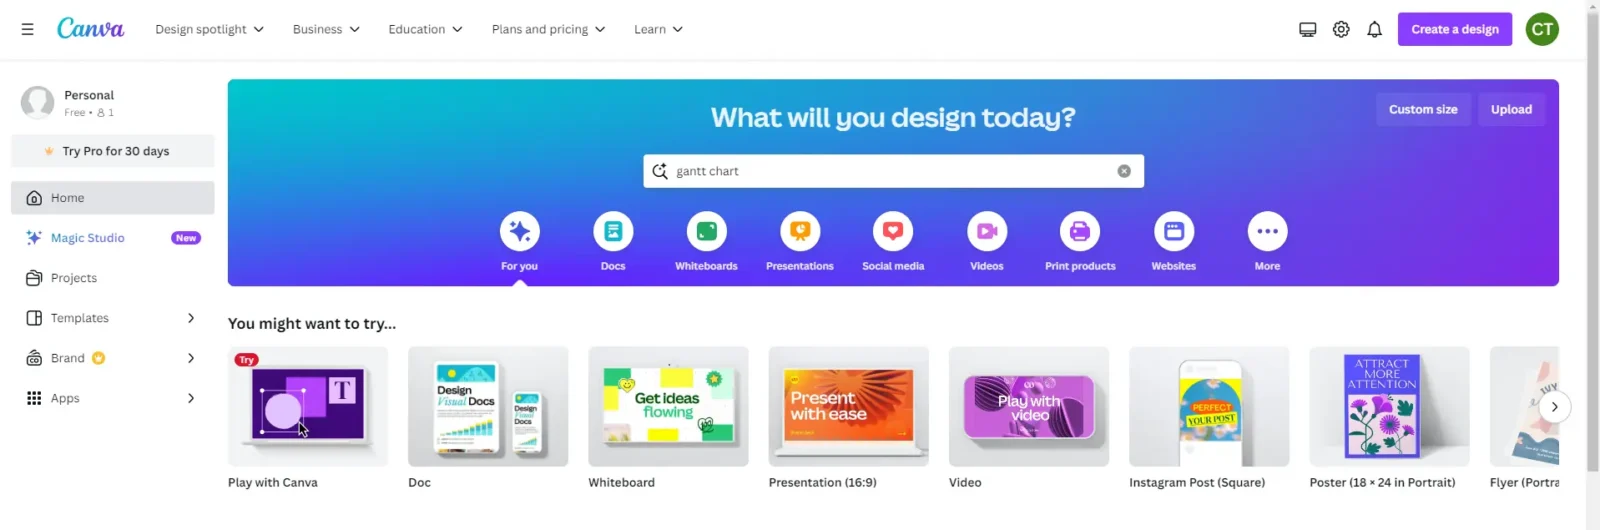
First, log into the Canva account and use the search box to look for a Gantt chart template.
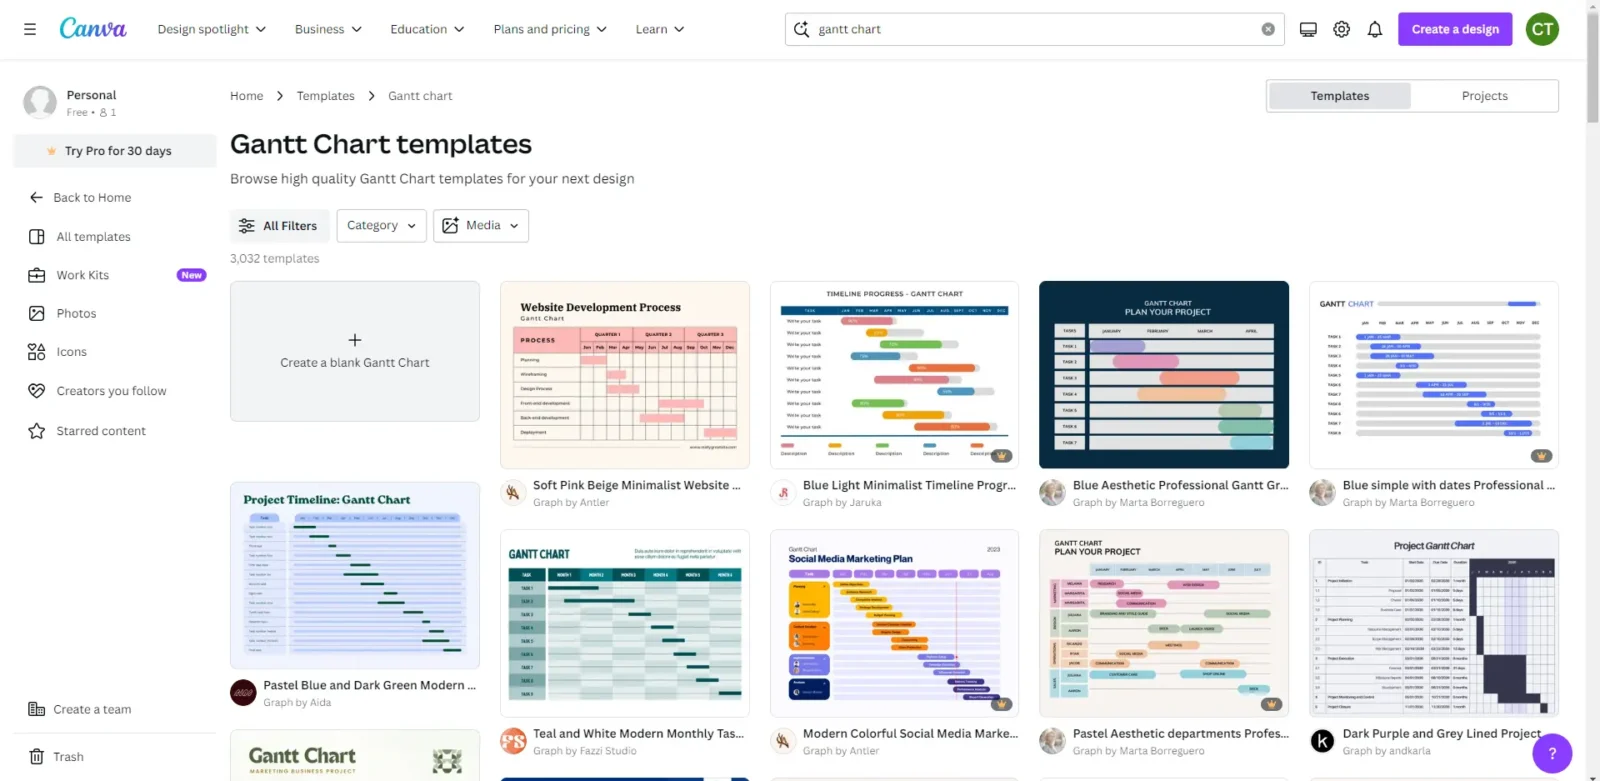
There are hundreds of Gantt chart templates in Canva’s library. However, some of them aren’t free and require a paid plan. Also, it’s important to notice that most Gantt chart templates available in Canva’s library are uploaded by users, so there might be some errors.
2. Edit the Canva Gantt Chart Template
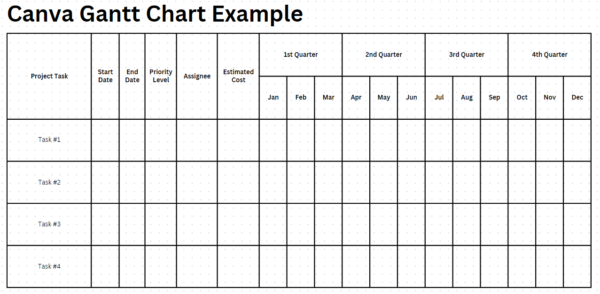
Then after having chosen a template, edit it further to visualize the project schedule as shown in the image below. We edited this Canva Gantt chart template to list project tasks and their due dates on a visual calendar.
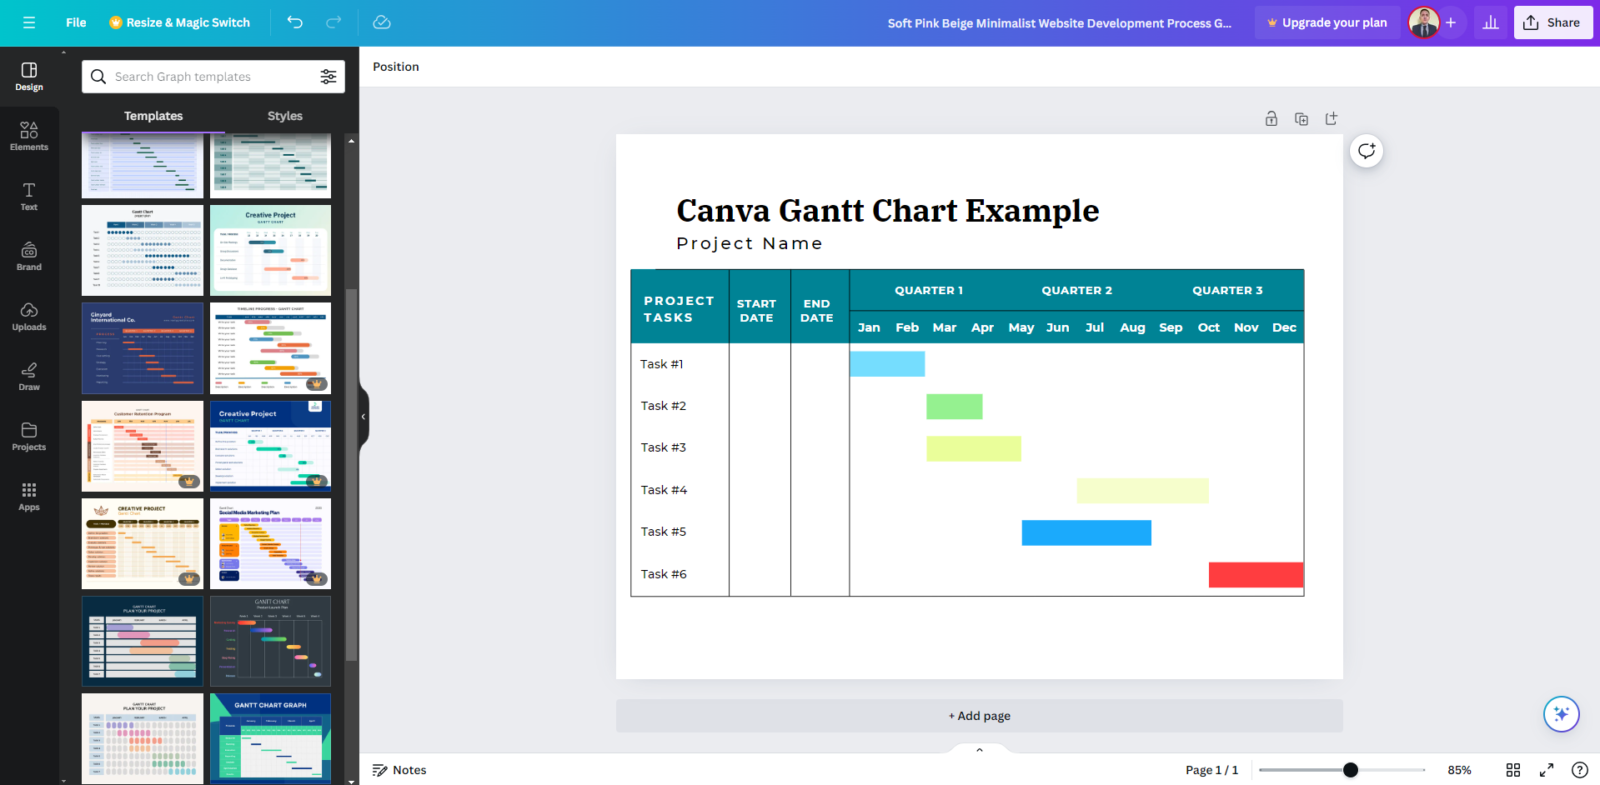
This is the most basic version of a Gantt chart. Ideally, a Gantt chart should track many other task details such as resources, costs, priority, status and more. Unfortunately, most of the project templates in Canva’s library have a similar level of detail as this template. On top of that, editing these Canva Gantt chart templates can be hard to do, as most of them don’t function as spreadsheets but rather as images which editing requires lots of manual work.
Make a Canva Gantt Chart From Scratch
To add more details to a Canva Gantt chart than those offered by Canva’s templates, make one from scratch by following the steps below.
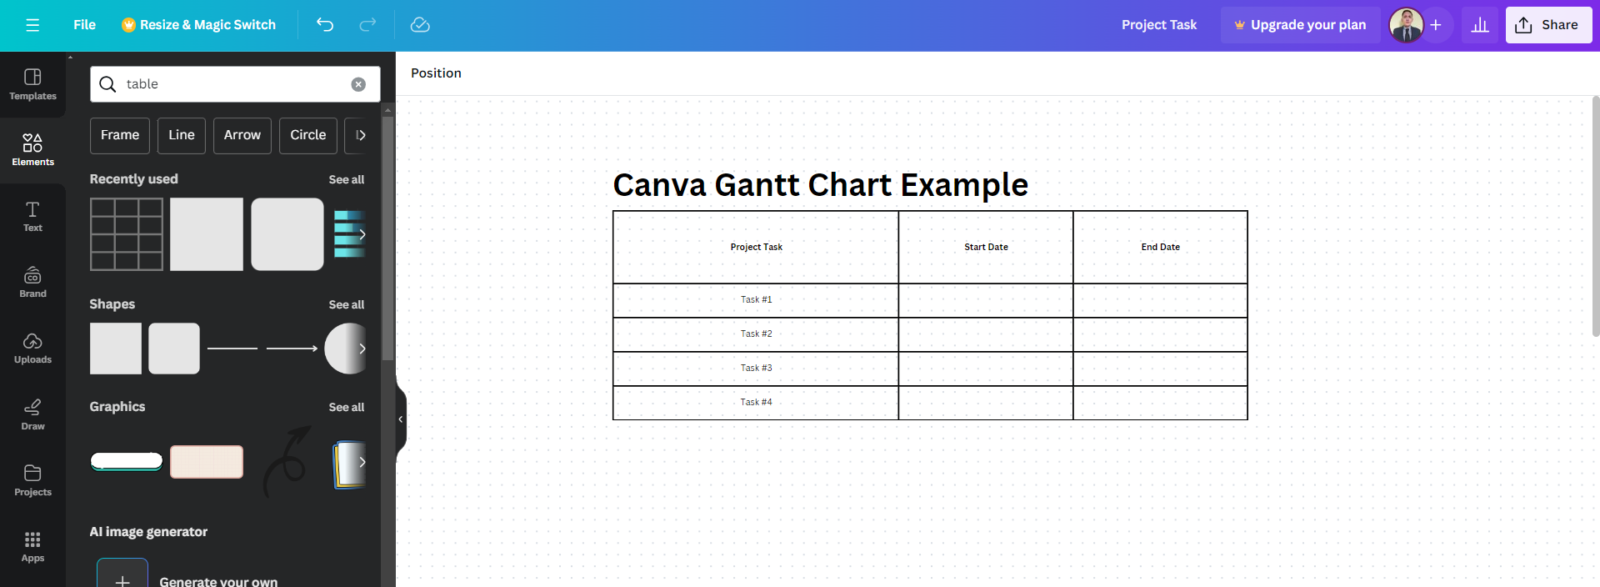
1. Make a Gantt Chart Grid in Canva
The easiest way to make a Gantt chart grid in Canva is to insert a table. To do so, open a new Canva presentation, whiteboard or document view and look for a table using the “Elements” search box on the left side of the screen. By default, the table will come with three columns, so begin by editing these three columns, one for listing your project tasks and their start and end dates.
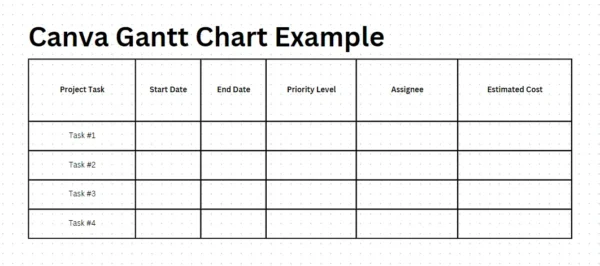
Now let’s add the fields we referenced, a priority level, assignee and estimated cost of each project task. To do this, simply click the three dots of the right-end column of the table and then click “Add column.” When done, the Canva Gantt chart grid should look like this.
2. Make a Gantt Chart Timeline in Canva
Now, create the other half of the Canva Gantt chart, the stacked bar project timeline. To do so, add 12 columns to the right and one row at the top.
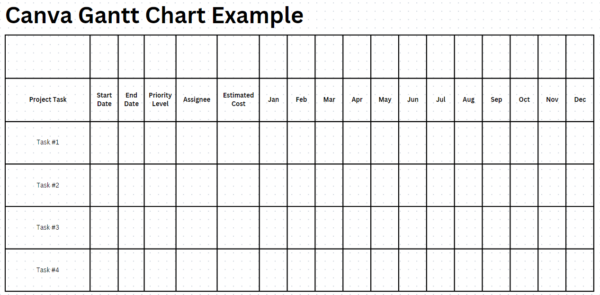
Then merge those cells until it looks like the example below.
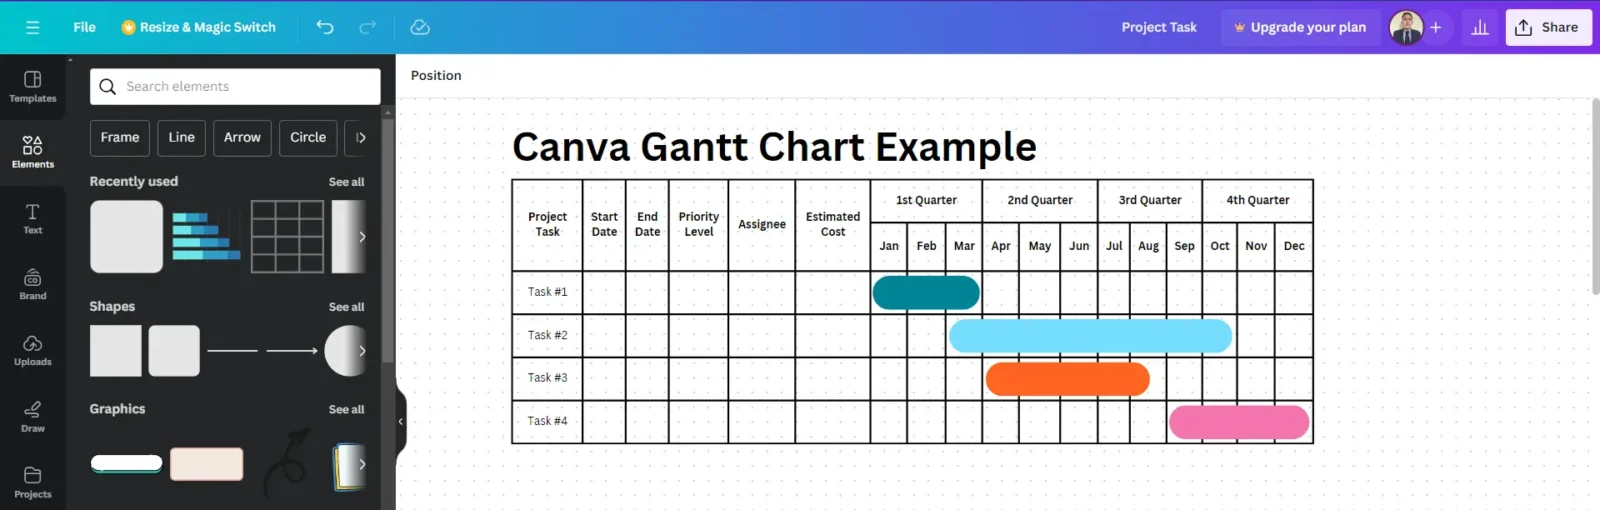
Finally, insert rounded square shapes and adjust their size to fit each of the project task rows to indicate their duration. Fill out all the Gantt chart grid cells with the project information and adjust the task bars accordingly.
ProjectManager Has Better Gantt Charts Than Canva
As stated above, ProjectManager is software specifically designed to plan, schedule and track projects from start to finish, which is the main reason why it offers a much better Gantt chart tool than Canva. Let’s zoom into other advantages of using ProjectManager’s Gantt charts.
Advanced Gantt Chart Features
ProjectManager is one of the best Gantt chart software due to its advanced project management features that will allow you to link four types of task dependencies, allocate resources, identify the critical path of your project, track project costs and much more. Use the task information panel popup on the Gantt chart to change priority levels, set milestones, add inter-project dependencies and more.
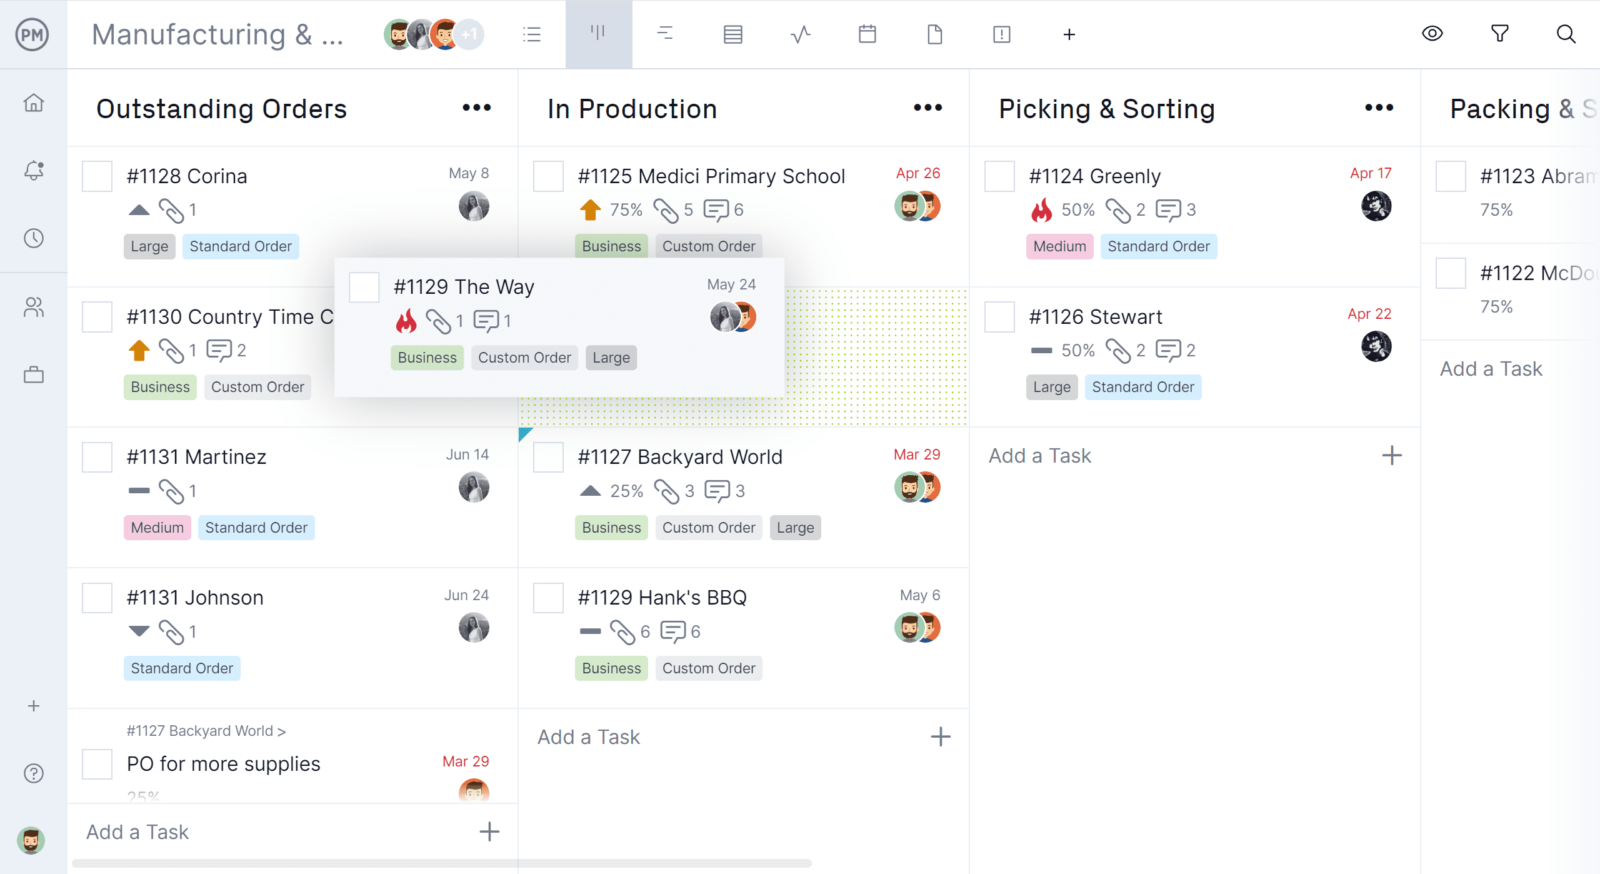
Multiple Project Management Tools
Use other project management tools besides Gantt charts such as kanban boards, project calendars, task lists, roadmaps and spreadsheets. Each of these offers a different perspective on your projects.
Track Project Progress, Schedule, Resources & Costs
Real-time dashboards automatically collect data from the Gantt chart in real time and show project metrics in easy-to-read charts for a high-level overview of the project status. Customizable reports get more detailed information on project and portfolio status, workload, timesheets, variance and more.
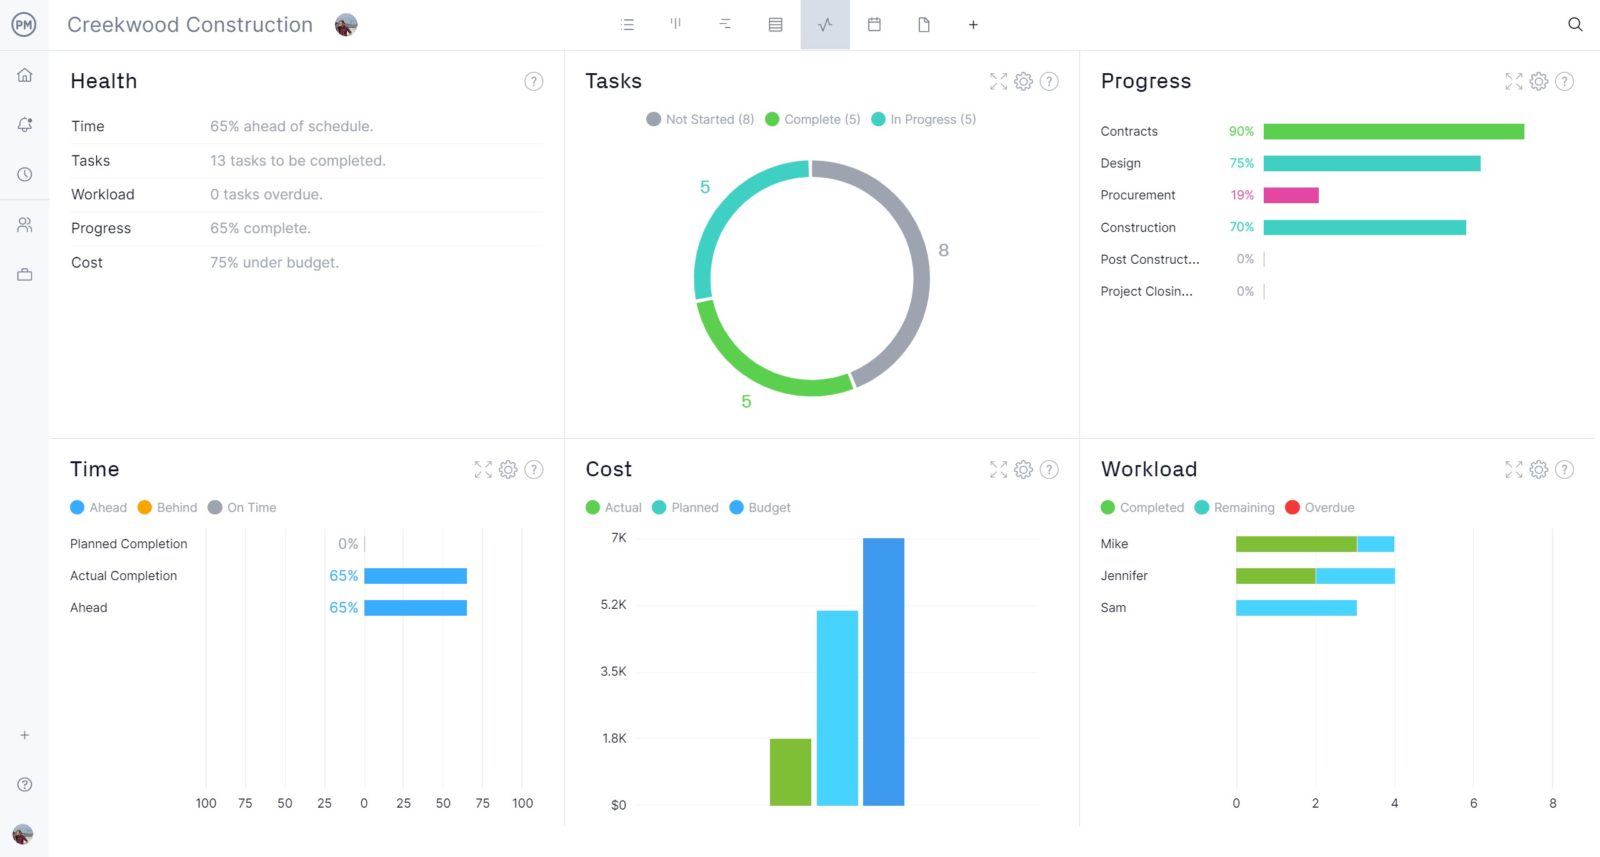
Resource management tools, such as the color-coded workload chart and team page show how work is being distributed among team members so you can reallocate resources to keep teams working at capacity and increase productivity.
More Free Gantt Chart Templates
While Excel is the most popular choice for Gantt chart templates, other free productivity tools can help make a Gantt chart.
While all these Gantt chart templates can be used to make a simple project schedule, they can’t compete with the functionality offered by project management software like ProjectManager.
Related Gantt Chart Content
We’ve created dozens of blogs, templates and guides to help understand how to use Gantt charts to manage projects. Here are some of them.
ProjectManager is online project and portfolio management software that connects teams in the office, out in the field and anywhere in between. They can share files, comment at the task level and stay updated with email and in-app notifications. Join teams at Avis, Nestle and Siemens who use our tool to deliver successful projects. Get started with ProjectManager today for free.


