

A SIPOC diagram is a simple yet effective way to visualize how processes function within an organization. It helps teams understand the flow of work from start to finish, ensuring all steps are clearly outlined. This type of tool is often used to improve efficiency, support quality management and align teams around a shared understanding of business processes.
Many organizations use a SIPOC diagram at the start of a project to define the scope of a process, establish accountability and identify potential areas for improvement. It offers a high-level perspective that helps teams quickly recognize where inputs come from, how processes transform them and who receives the final outputs.

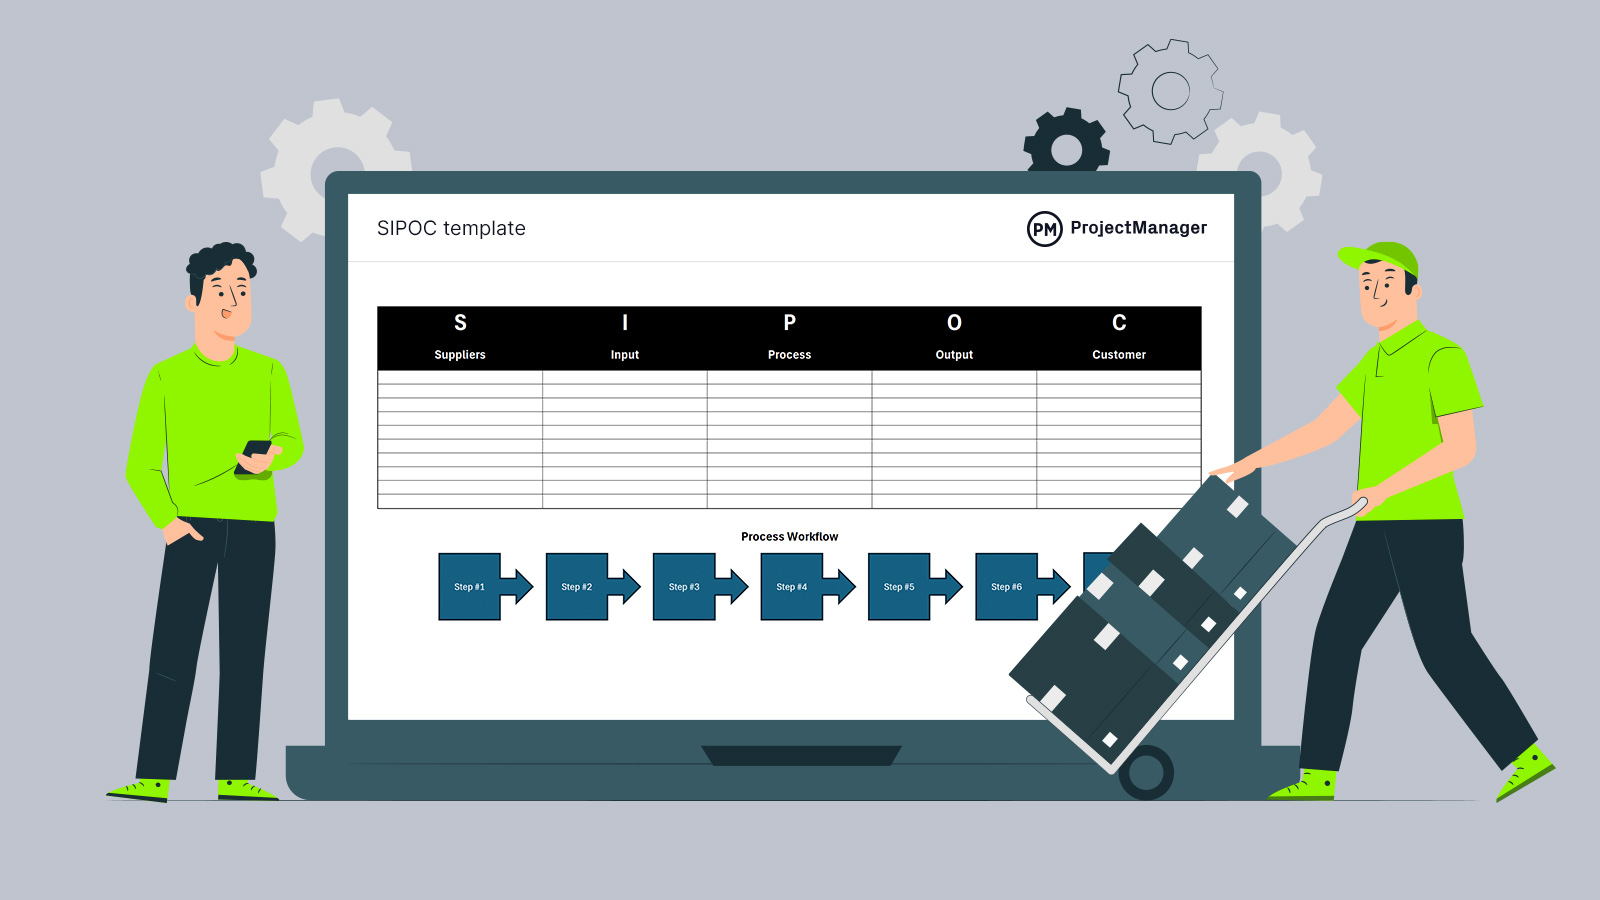
Get your free
SIPOC Template
Use this free SIPOC Template to manage your projects better.
What Is a SIPOC Diagram?
A SIPOC diagram is a visual tool that outlines five key elements of a process: Suppliers, Inputs, Process, Outputs and Customers. It provides a structured way to document how work moves through each stage of production or service delivery. By capturing this information in one view, teams can better understand dependencies and ensure that each step supports organizational goals.
Project management software supports the creation and maintenance of SIPOC diagrams by offering centralized workspaces where teams can define processes, assign responsibilities and track deliverables in real time. It also allows easy updates and version control, which is essential when multiple departments are involved in refining a process.
ProjectManager is the ideal platform for creating and managing SIPOC diagrams because it combines visualization, collaboration and reporting in one solution. Teams can map processes using Gantt charts or kanban boards, manage tasks linked to each step of the diagram and analyze performance metrics through real-time dashboards powered by AI. This level of visibility helps organizations move from process mapping to measurable improvement. Get started with ProjectManager today for free.
When to Make a SIPOC Diagram
A SIPOC diagram should be created at the beginning of a process improvement or project planning initiative. It helps teams gain a clear understanding of how work flows through a system before changes are made. By identifying suppliers, inputs, processes, outputs and customers early, teams can avoid confusion and misalignment later in the project.
Organizations often make a SIPOC diagram when defining or refining workflows, implementing new systems or onboarding cross-functional teams. It’s especially valuable during the planning stage because it ensures all stakeholders share the same understanding of what the process includes and what it delivers.
Benefits of Making a SIPOC Diagram
A SIPOC diagram offers several key advantages for businesses that want to improve process efficiency and communication. It provides a clear, visual overview that helps teams understand how their roles fit within a larger workflow. This clarity reduces bottlenecks, eliminates redundant tasks and ensures that everyone focuses on outcomes that add value to customers.
Another major benefit of using a SIPOC diagram is that it promotes collaboration between departments. By involving suppliers, team members and customers in the discussion, organizations can capture a full picture of the process and identify issues before they become problems. The result is a more streamlined operation that delivers consistent quality and measurable improvement over time.
Related: 38 Project Management Excel Templates and Spreadsheets for Free
How to Make a SIPOC Diagram
Creating a SIPOC diagram is a straightforward process that helps teams clearly define how work moves from start to finish. Each step builds on the last to ensure you capture every key element of the workflow. Follow these five steps to develop a complete picture of your process and communicate it effectively across departments.
1. Identify Your Suppliers
Start by listing the suppliers who provide the materials, data or services needed for your process. These can be internal departments, external vendors or individuals who deliver key inputs. Identifying suppliers ensures that all contributors are recognized and that their roles in maintaining process quality are clear from the beginning.
2. Estimate What Resources Will Be Needed as Inputs
Next, determine the inputs required to carry out the process. Inputs may include raw materials, data, tools, or even personnel. Clearly defining these inputs helps ensure that your process has the necessary resources to run smoothly and consistently. This step is critical for understanding dependencies and potential resource constraints.
3. Define the Process That Will Transform Inputs Into Outputs
Outline the series of steps that convert your inputs into final outputs. This should be a high-level description, not a detailed workflow. Focus on key activities that drive transformation, ensuring each one adds value and contributes to the desired result. Clarity here prevents redundancy and highlights areas for process improvement.
4. Describe the Expected Outputs
List the products, services or results that come from your process. Outputs should directly reflect the objectives of the process and meet the expectations of the customers. By defining outputs clearly, teams can measure whether the process delivers what was intended and adjust steps to improve performance when needed.
5. Identify the Customers Who Will Receive the Outputs
Finally, specify the customers who receive the outputs, whether they are external clients or internal stakeholders. Understanding who benefits from your process ensures that their needs guide decision-making. It also helps teams prioritize improvements that enhance value and strengthen the relationship between operations and customer satisfaction.

SIPOC Diagram Template
Download this free SIPOC diagram template to provide a structured format that captures the essentials of a process—Suppliers, Inputs, the Process itself, Outputs and Customers—without requiring teams to design a layout from scratch. Using a pre-formatted template improves consistency across projects and departments and saves time during process definition or improvement initiatives. Teams can focus on the content rather than the format, enabling quicker alignment and decision-making when initiating or analyzing a workflow.
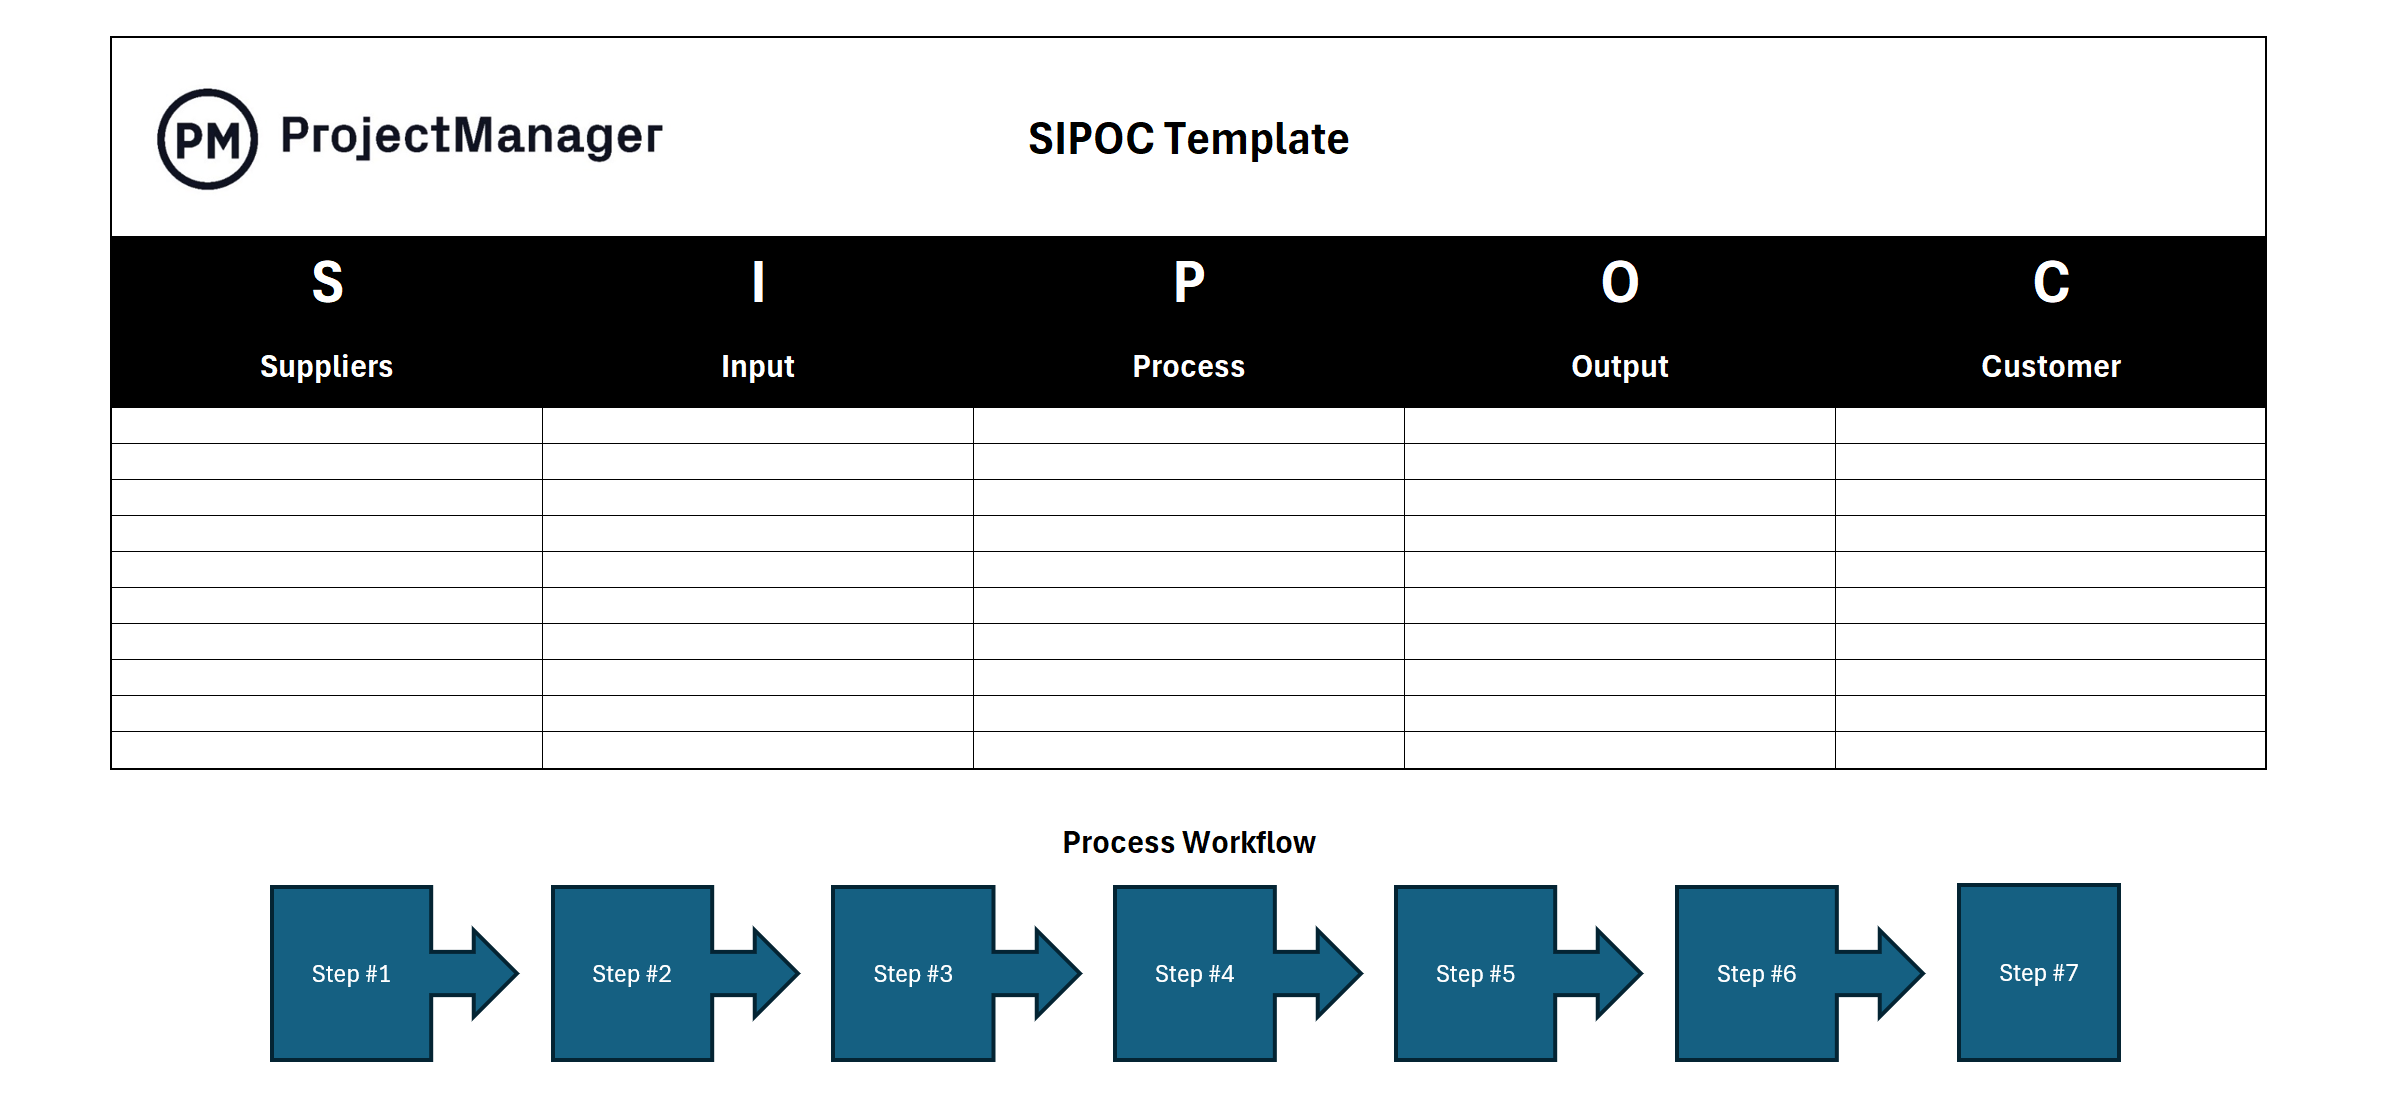
The free SIPOC template allows users to download an Excel version that is ready to use immediately. It helps project teams define process specifications, identify who supplies inputs and highlight customer requirements clearly. Whether onboarding new employees, documenting a process for the first time or conducting a lean Six Sigma project, this template supports transparency, stakeholder collaboration and consistent documentation across workflows.
SIPOC Diagram Examples
A SIPOC diagram example is the best way to understand how a SIPOC diagram works in a real-world scenario. Here are two examples of how a SIPOC diagram can be used to manage business operations.
Manufacturing SIPOC Diagram Example
Below is a simple SIPOC diagram example for a manufacturing process. In this scenario, a manufacturing firm applies a SIPOC framework to assemble new office desks that will be ready for customers.
There’s a table with five columns, each one corresponding to a SIPOC element. Here, the suppliers may include providers of timber, hardware distributors supplying screws and brackets, paint or finish vendors and companies that supply tools or machinery.
Next are the inputs—the materials and resources required or consumed throughout the process to produce the expected results. For this manufacturing SIPOC example, inputs consist of wooden planks or panels (such as plywood or MDF), fasteners like screws, nails and brackets, finishing materials like varnish, paint or laminate, tools for cutting and assembling and the necessary design plans or blueprints.
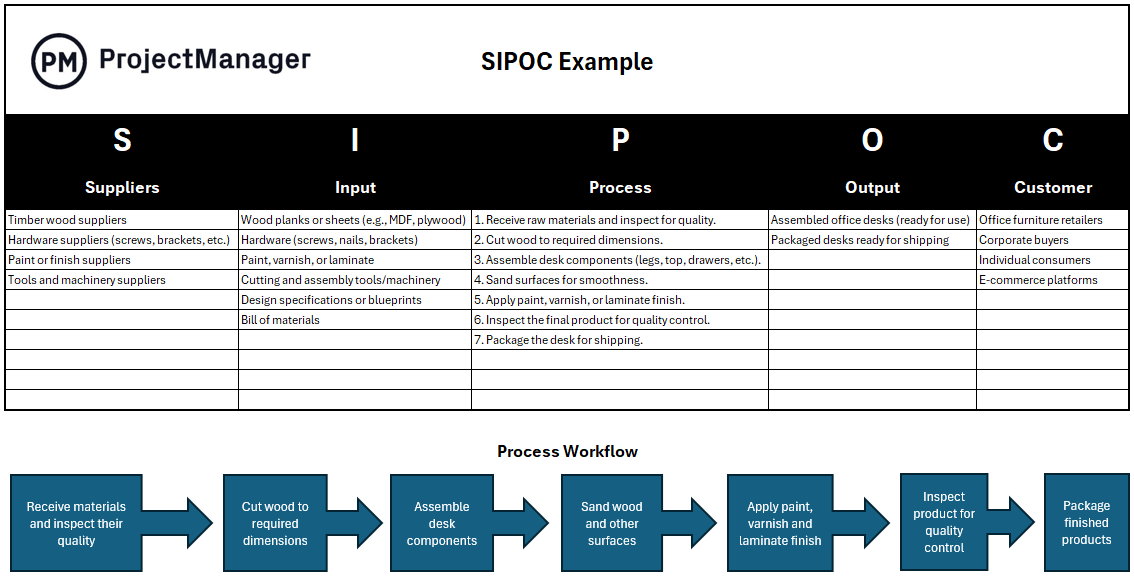
The process section follows. Once raw materials arrive, they go through a quality inspection. The wood is then cut to the specified measurements and the desk parts—legs, drawers and top—are put together in line with the bill of materials. After assembly, the surfaces are sanded smooth and coated with paint, varnish or laminate. The finished desks undergo a final quality check before being packaged for delivery.
Outputs represent the final results of the process. In this SIPOC diagram example, the completed office desks and the packaged units ready for shipment are the outputs. Customers may include office furniture retailers, corporate clients, individual buyers and online marketplaces.
Related: Free Project Management eBook for Manufacturers
Process Management SIPOC Diagram Example
For a straightforward SIPOC diagram example, picture a food and beverage company documenting one of its routine workflows—preparing healthy smoothies.
To begin, set up a table with five columns that correspond to each element of the SIPOC model. The suppliers in this case provide the necessary ingredients, equipment and additional items like cups, straws and napkins used to prepare and serve the smoothies.
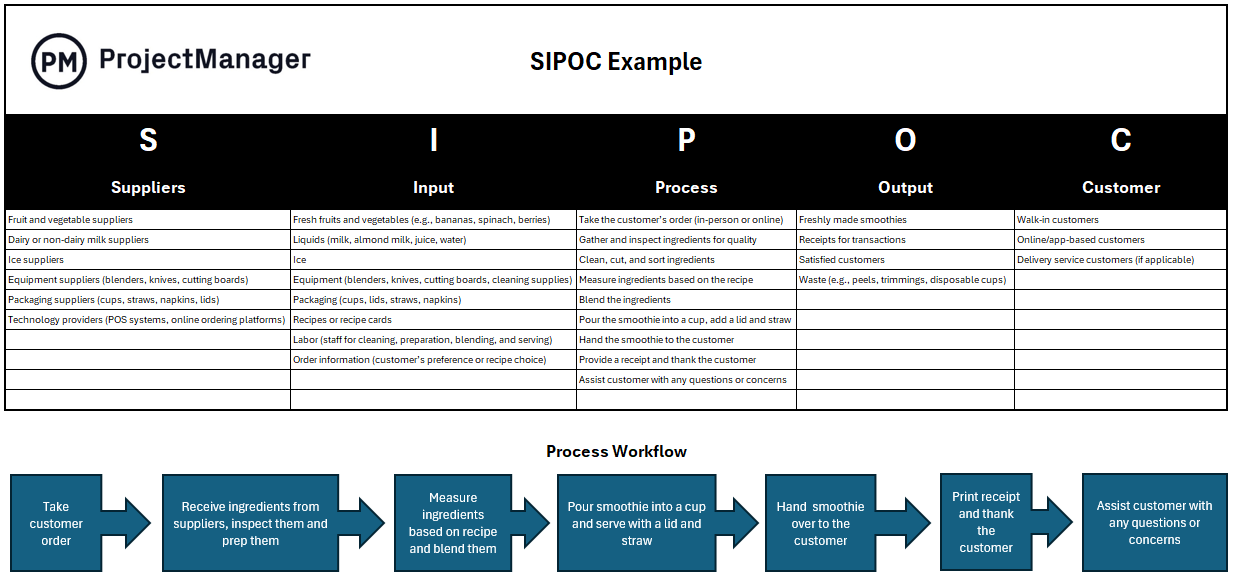
Now let’s move on to the process itself. It begins when an order is received from the customer. After that, the ingredients are washed, sliced and organized. Once everything is prepared, the ingredients are blended according to the recipe specifications. The finished smoothie is then poured, served and delivered to the customer.
The outcome of this workflow is a tasty smoothie—and ideally, a satisfied customer. After handing over the receipt, there’s even a chance the customer will leave a tip as appreciation for good service. This brings us to the final element of this SIPOC diagram example: the customer, who could be someone visiting the store in person or placing an order online through a website or mobile app.
Free Related Templates
In addition to the SIPOC diagram template, other free templates help teams visualize and manage processes effectively. These templates complement the SIPOC diagram by providing more detailed views of workflow steps, stock tracking and inventory management. Using these templates together ensures teams can map, monitor and optimize operations efficiently while maintaining accuracy and transparency across all processes.
Process Map Template
Download this free template to allow teams to visually outline the sequential steps in a process, helping identify bottlenecks, inefficiencies and areas for improvement. It is ideal for detailed process analysis and complements a SIPOC diagram by adding granular visibility into workflow activities.
Stock Register Template
Track and manage inventory with this free template, logging stock levels, suppliers and locations. It ensures organizations maintain accurate records of materials and products, supporting both operational efficiency and strategic planning.
Inventory Template
Designed for comprehensive inventory management, this template helps teams monitor stock movements, reorder levels and stock valuations. It works alongside SIPOC and process mapping tools to ensure seamless management of physical resources within processes.
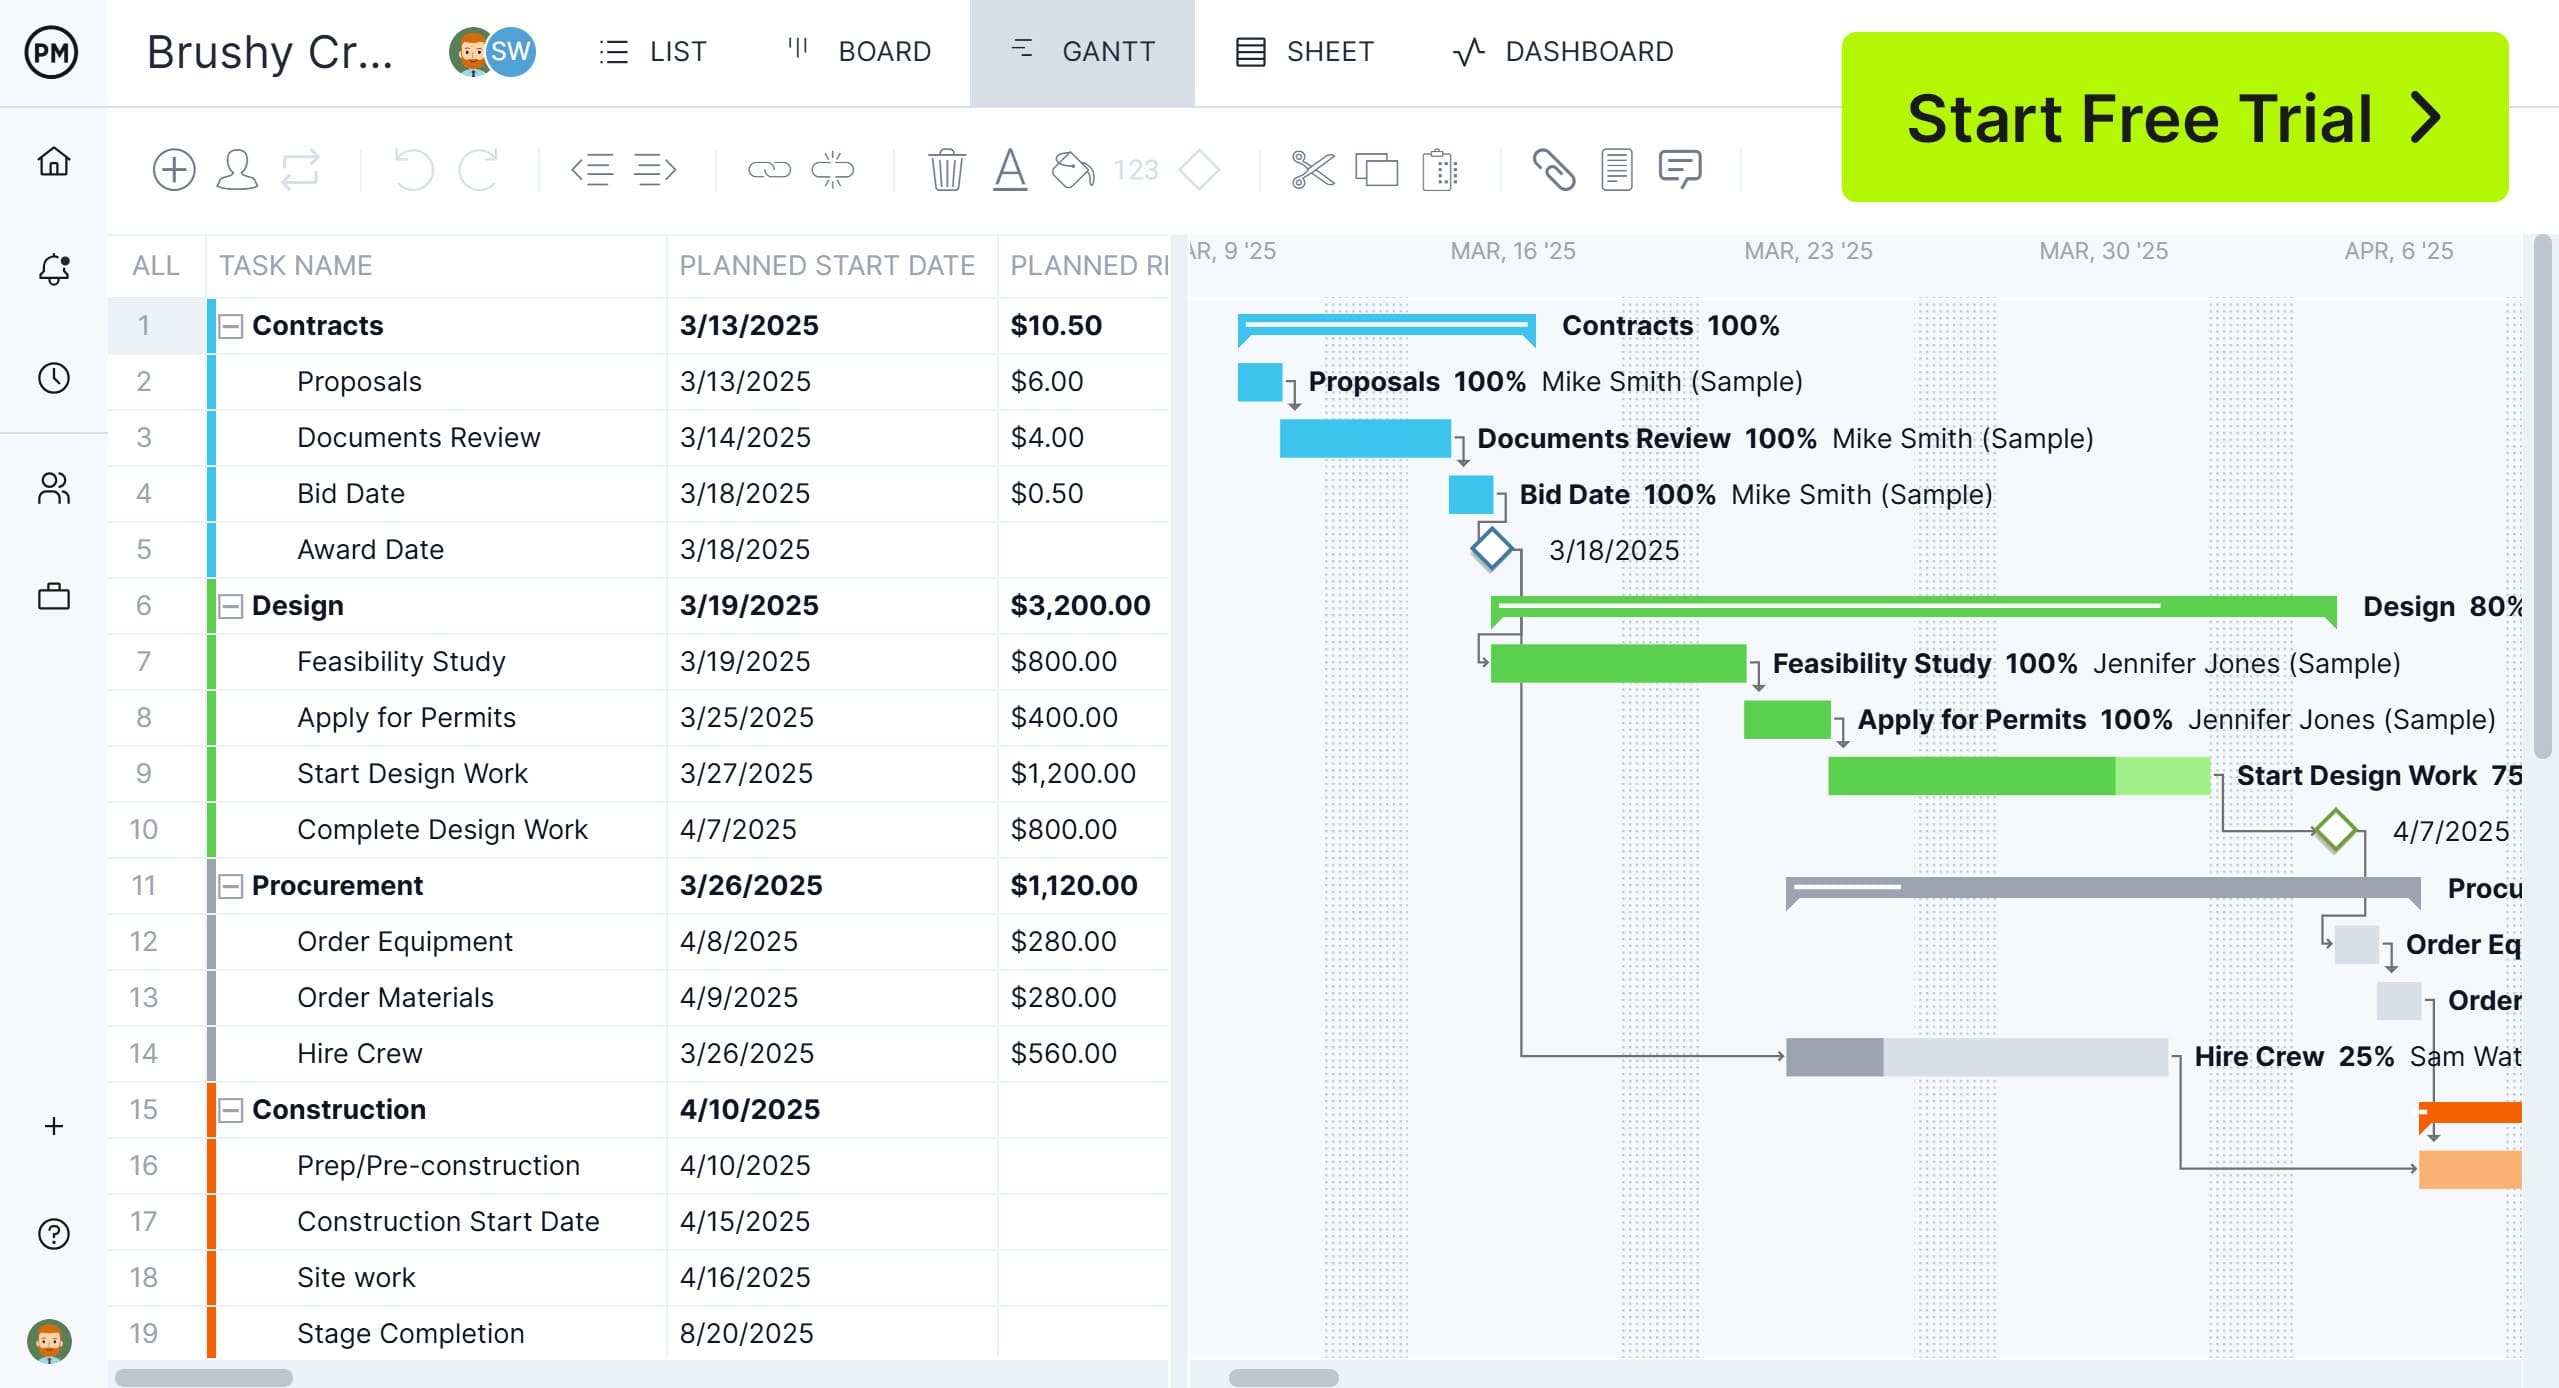
How to Manage Projects and Processes With ProjectManager
ProjectManager is a comprehensive platform that helps teams manage projects and processes with clarity and efficiency. By providing multiple project views, including Gantt charts, kanban boards and task lists, managers can visualize workflows, track progress and make informed decisions. Its cloud-based interface allows teams to collaborate in real time, ensuring everyone stays aligned on tasks, deadlines and project goals.
Plan and Allocate Resources Effectively
ProjectManager enables managers to assign tasks, schedule resources and track workloads across multiple projects. With features like workload charts, timesheets and a team page, teams can balance capacity, prevent bottlenecks and optimize productivity. Automated notifications keep everyone aware of upcoming tasks, ensuring smoother execution and less manual oversight.
Monitor and Optimize Performance
Our software provides detailed reports, real-time dashboards powered by AI and analytics to track project performance and process efficiency. Managers can quickly identify delays, cost overruns and resource imbalances, then take corrective actions. ProjectManager’s integrated tools allow continuous monitoring and optimization, giving teams the visibility they need to deliver projects successfully and maintain high process standards.
Related Content
A SIPOC diagram can be used in manufacturing and process management for businesses. For those who care to learn more, check out the links below. There are articles on business process improvement, how to make a process improvement plan and much more.
ProjectManager is online project and portfolio management software that connects teams, whether they’re in the office or out in the field. They can share files, comment at the task level and stay updated with email and in-app notifications. Get started with ProjectManager today for free.


