


Before New York City voted to freeze rents for more than 1 million rent-stabilized apartments, one member of the Rent Guidelines Board tried to make a point about the buildings themselves.
“As the owner’s representative, my primary concern is ensuring that rent-stabilized buildings…” Maksim Wynn began, before a raucous crowd drowned him out with chants, whistles, and boos.
He was trying to raise a question about whether landlords could keep up with repairs and rising operating costs if rents remained flat. The crowd was focused on a different reality: the growing number of tenants already spending too much of their income on housing.
Wynn ultimately voted for the freeze, which passed 7-1.
It was a brief, chaotic moment. But it captured a conflict now playing out across the housing market: Everyone seems to have a bill they cannot absorb—and someone else they think should be paying it.
Tenants say rents are too high. Landlords argue the cost of operating buildings is climbing faster than rents. Buyers point to mortgage rates, debt, insurance, and myriad other costs eating through their budgets. Sellers hold plenty of equity on paper, but many say it still falls short of what they need to buy their next home.
Here are five numbers that help explain the cash crunch ricocheting through every corner of the market.
This article originally appeared in By The Numbers, a new Substack series from Realtor.com.
Homeowners are pulling cash from their homes
Homeowners tapped an estimated $47 billion in equity during the first three months of 2026, according to the June 2026 ICE Mortgage Monitor—the highest first-quarter withdrawal since 2021.
Perhaps more striking are the 3.9 million homeowners who took out a mortgage between 2020 and 2022, when rates were at historic lows, that now carry a second lien as well. While these owners’ first mortgage may still be unusually cheap, they’re now pairing it with a newer, often variable-rate, debt product.
It’s a stark illustration of how the cash crunch has reached even the equity-rich.
Of course, that’s not to suggest that all of these homeowners are in financial trouble. Some are financing renovations, consolidating higher-interest debt, or making a strategic choice to preserve a low-rate first mortgage. But it does show how often the cash coming in is falling short of the needs piling up around them.
And there is evidence that, for a growing number of homeowners, those needs are not luxuries. Instead, they’re required costs like property taxes, insurance, utilities, repairs, and the ordinary expenses of owning a home.
The total monthly cost of owning the median-priced home reached $3,120 at the end of 2025, and today, there are 20.7 million cost-burdened homeowner households—an increase of 4 million from 2019.
Mortgage rates aren’t the only thing shrinking buyers’ budgets
The average payment for a new car can erase as much as $135,000 from a buyer’s housing budget, in a dramatic display of how other necessities are playing a larger role in the market.
New-car loan payments hit an all-time high of $770 in the first quarter of the year, following a sharp run-up in vehicle prices and borrowing costs.
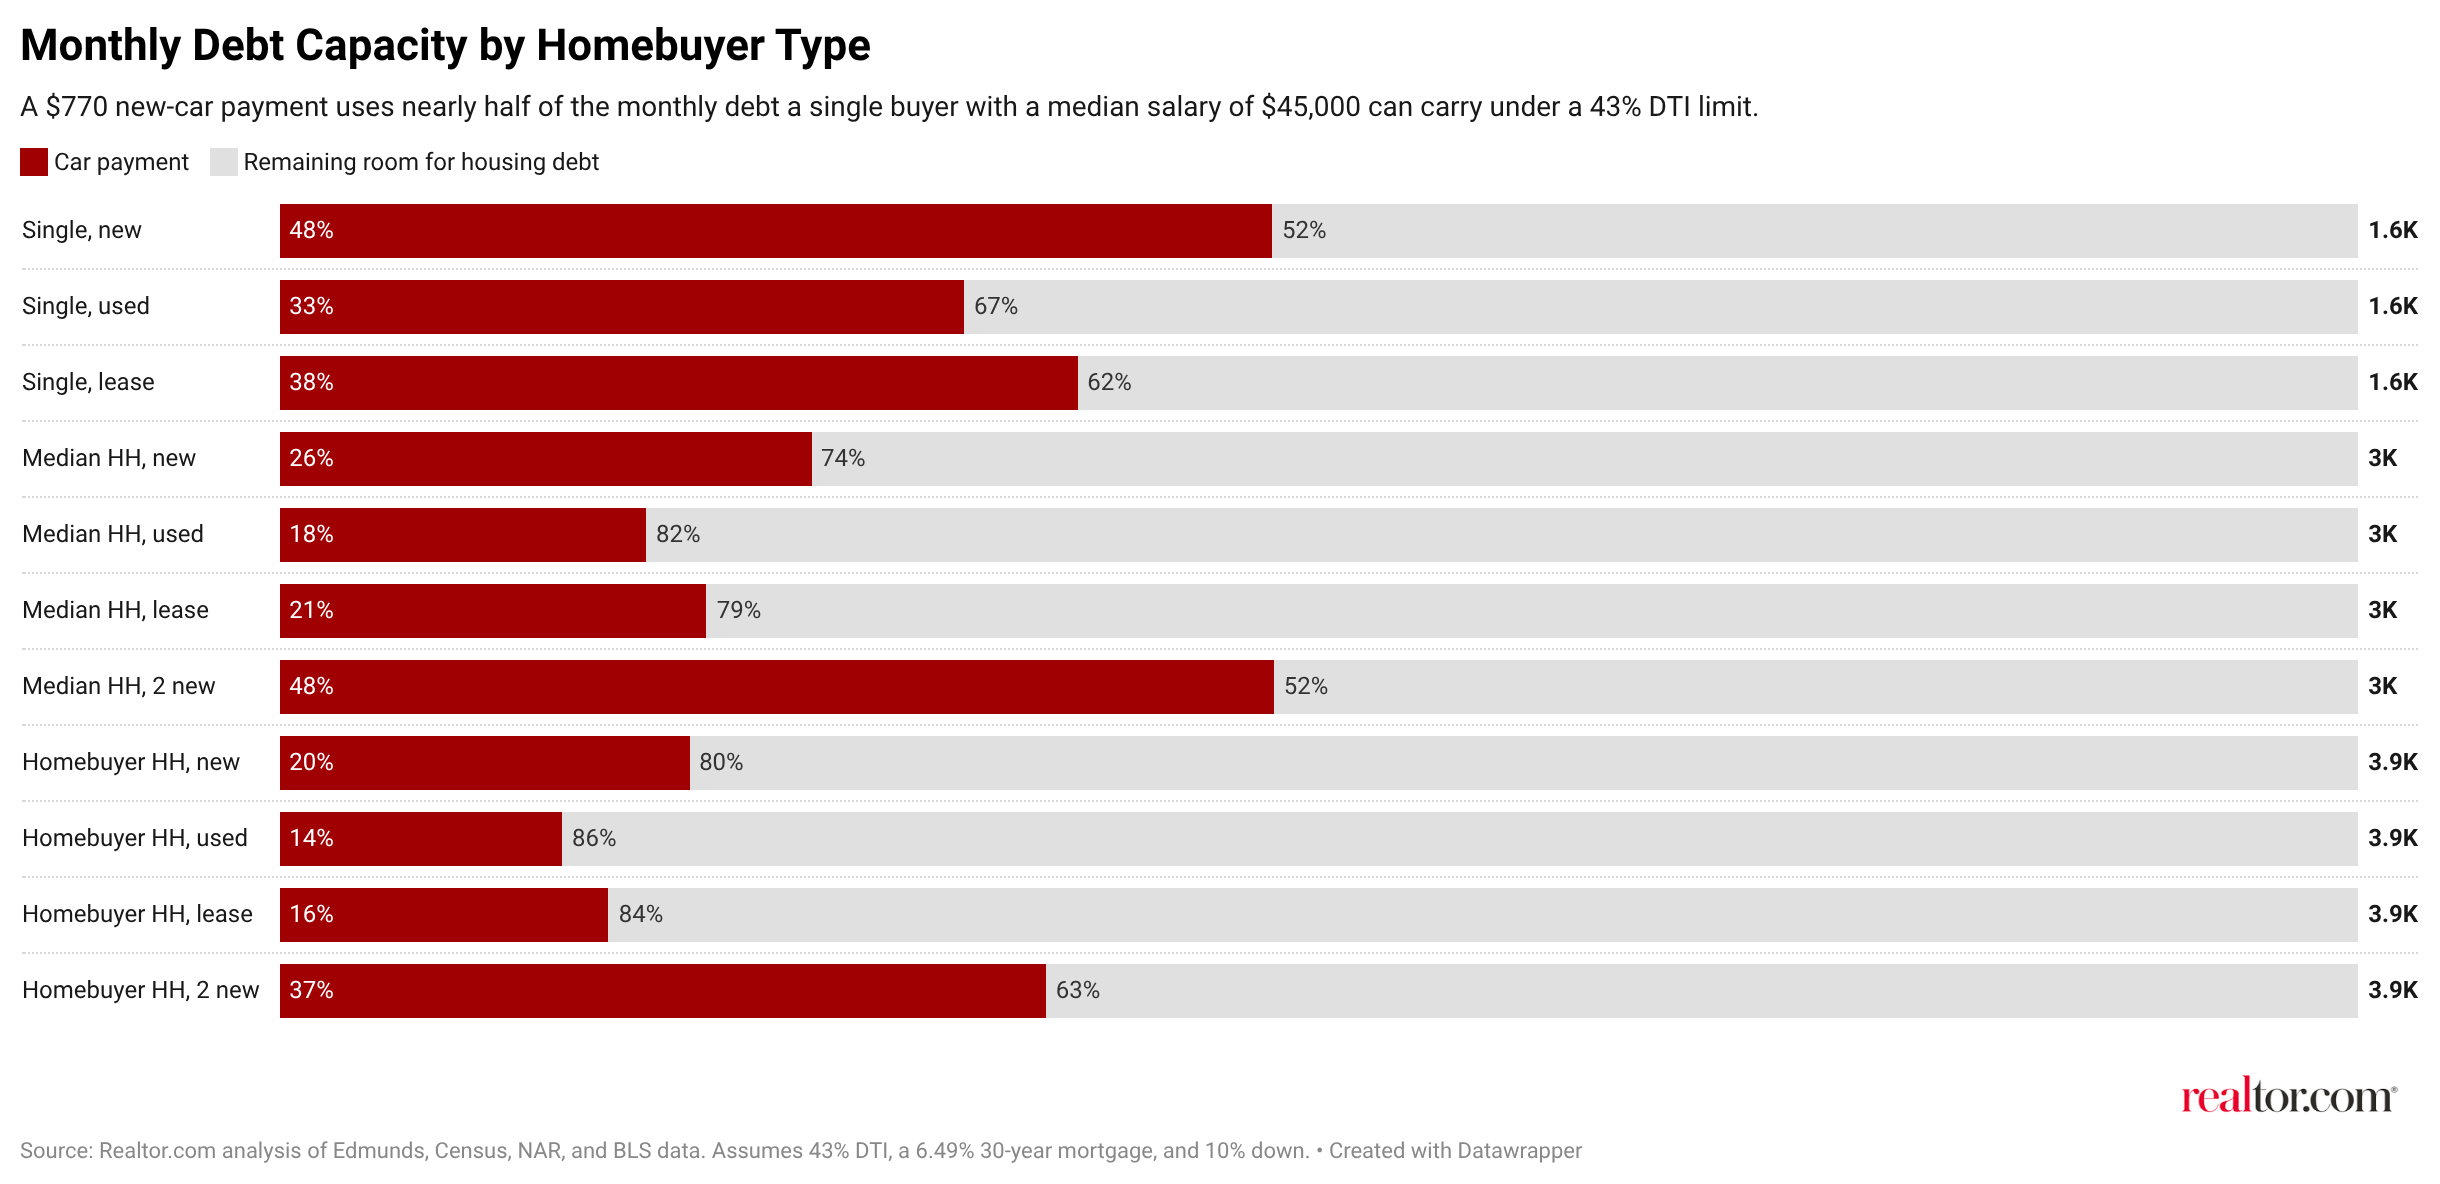
Under a standard mortgage scenario—a 10% down payment, a 6.49% rate, and a 43% debt-to-income ratio—that monthly payment would consume nearly half of a single buyer’s allowable debt-to-income ratio, erasing $135,000 from their purchasing power.
It’s another stark example of how basic costs are competing directly with housing in household budgets.
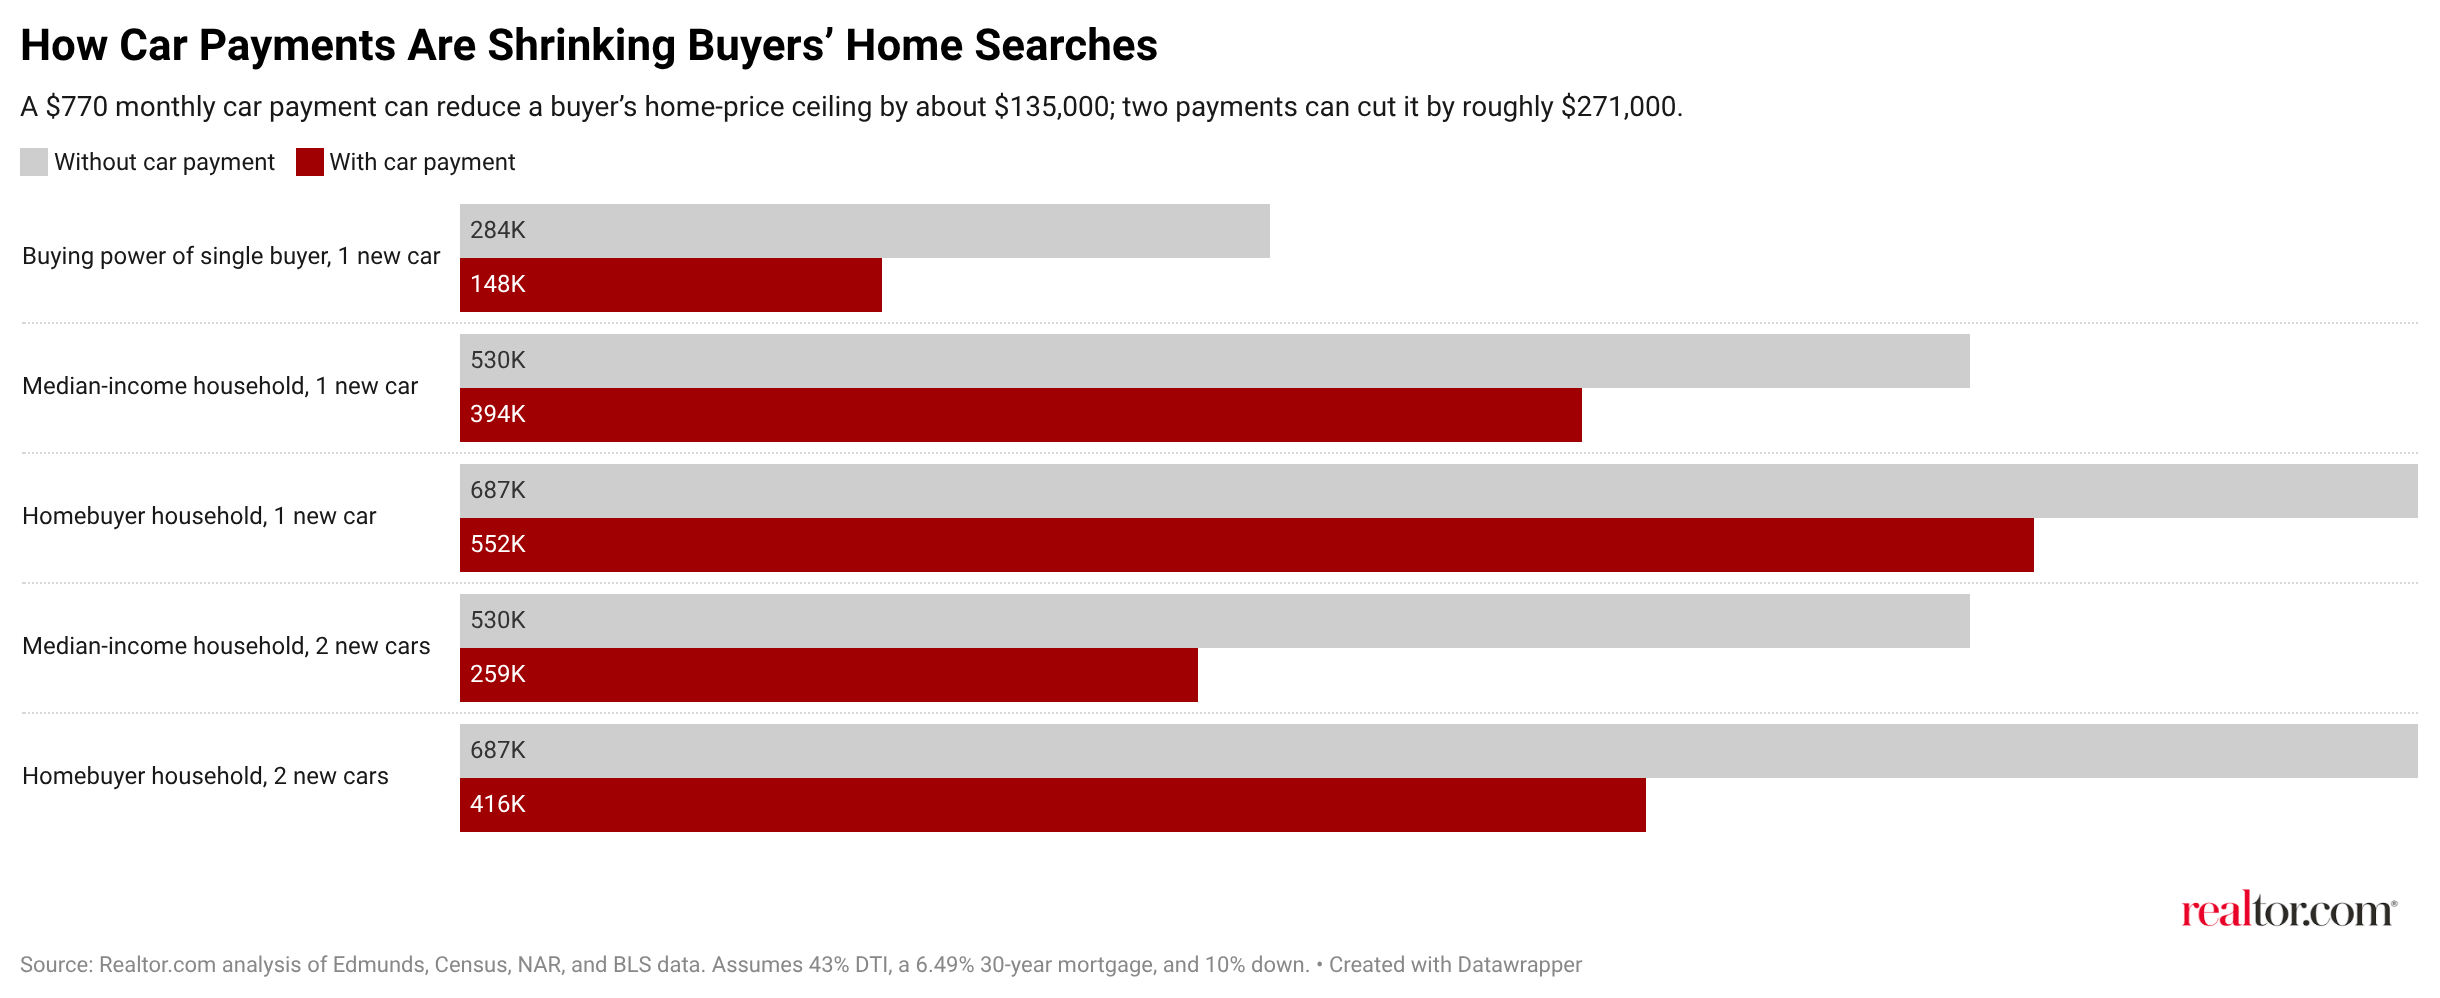
And with the median home price now at $430,000, that competition may be pricing some otherwise well-qualified buyers out of the market. For a household earning the median income, one new-car payment would drop their estimated purchase-price ceiling from roughly $530,000 to $394,000.
The finding complicates the familiar narrative that buyers simply are not saving enough because they spend too much on avocado toast or fancy vacations. For many households, a car is what gets them to work, helps them care for family, or makes life possible in places with limited public transit—not a luxury cost that can simply be cut.
Sellers feel the pinch of slowing appreciation
Even sellers are feeling the squeeze, with national home values rising just 0.8% in April from a year earlier, according to the latest S&P Cotality Case-Shiller Index.
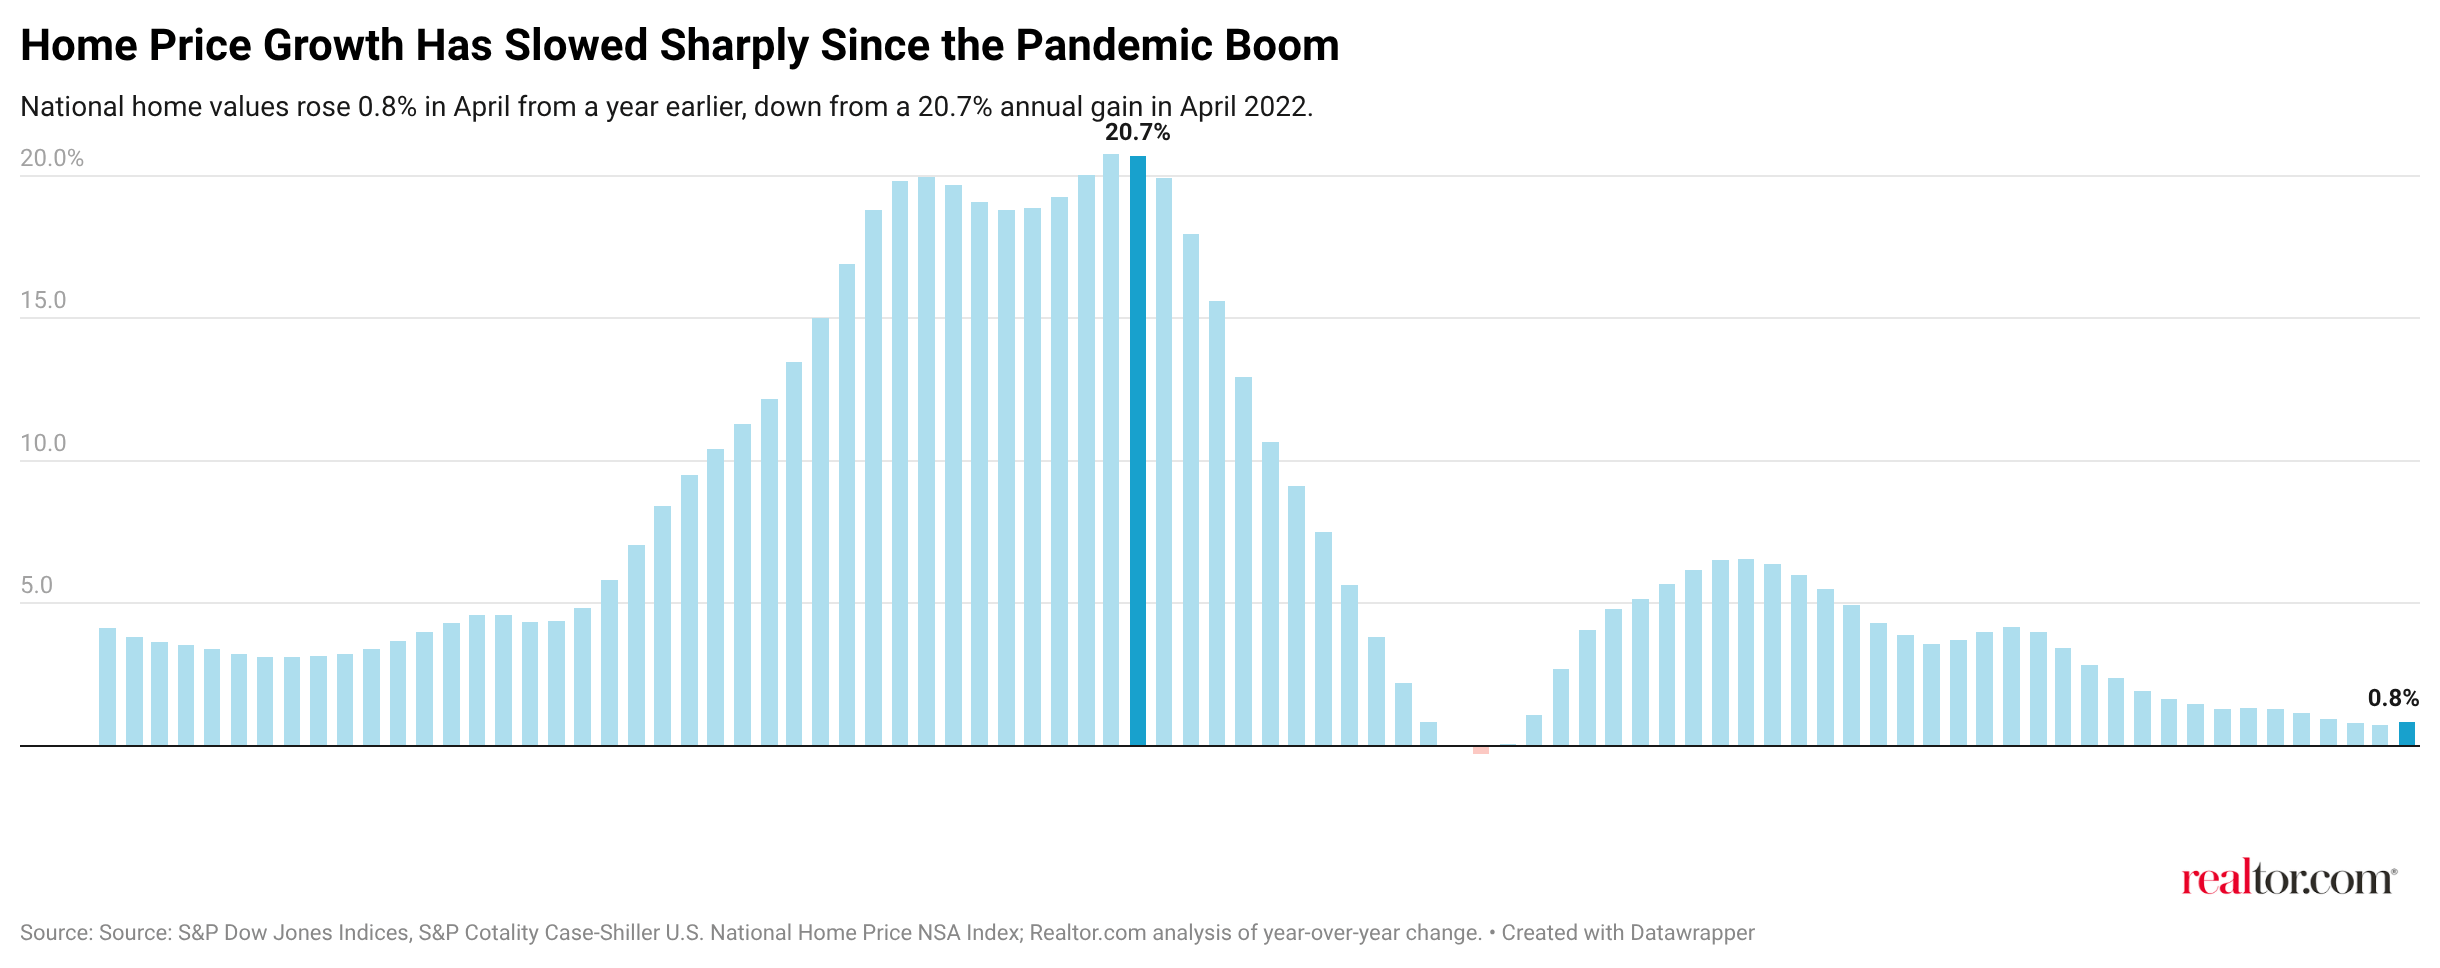
While it’s a move in the right direction (up), it’s not enough growth to beat inflation, which is up 4.2% compared to a year ago. And in real terms, home values fell for the 11th straight month, weakening the wealth-building engine that helped many owners feel financially secure during the COVID-19 pandemic boom.
Those forces—cooling home prices and hot inflation—have created a darned-if-you-do, darned-if-you-don’t scenario for those on the margins.
Listing now can mean facing the reality of selling below the highs of 2022—something sellers have been resistant to for years. Waiting, meanwhile, may preserve the hope of a better price, but it also means watching inflation eat into the value of those gains while the cost of their next mortgage remains high.
It’s a harder side of the equity-rich cash crunch. For sellers who need to move, years of home price gains can look substantial on paper—until that equity has to cover the costs of selling, the down payment on the next home, and a monthly mortgage payment at today’s rates.
For the most burdened renters, relief could be centuries away
In Dallas–Fort Worth, it could take an estimated 474 years to close the affordable housing gap for the metro’s most cost-burdened renters—even as rents overall are down 2.9% from a year earlier.
That’s nearly three times the comparable estimate of 169 years for the New York City metro area. Big Apple rents, meanwhile, were up more than 6% from a year ago.
The estimates come from the new Housing Affordability Toolkit from the National Multifamily Housing Council and NYU Urban Lab, a policy resource designed to help cities assess and address their rental-housing affordability gaps.
Only 13 metros in the ranking could close their affordable housing gaps in less than a century at their current pace. Every other metro in the report faces an estimated wait of at least 100 years, while St. Louis’ runway is over 900 years.
Interestingly, that timeline reflects a cash crunch for more than just the most cost-burdened renters.
Developers of deeply affordable housing often can’t collect enough rent to cover the cost of building, financing, and operating those apartments without public support—stalling projects and creating the kind of scarcity that pushes rent further out of reach for the whole market.
Of the country’s 22.4 million rent-burdened households, about 4.3 million could benefit from more market-rate supply. And 10.1 million have incomes too low for the private market to serve without subsidy. Roughly 8 million fall in between—too burdened for the market as it exists, but not necessarily eligible for deeply subsidized housing.
It’s a crunch in its most literal form: not enough money in household budgets to pay the rents developers need, and not enough subsidy in the system to close the difference.
Landlords say the cost of holding housing is rising, too
Landlords say they are facing that same harsh reality, paying 5.3% more than they were a year ago to operate rent-stabilized buildings in New York City.
Among the biggest drivers are insurance costs—up 10.5%, following an 18.7% increase the year before—and property taxes, according to the city’s Price Index of Operating Costs.
That doesn’t mean landlords are uniformly losing money. Inflation-adjusted net operating income rose 2.2% from a year earlier, a reminder that the financial picture varies widely across the city’s building stock.
But economists and building owners alike say that metric has limits.
“NOI represents day-to-day cash flows of running an apartment building, but it doesn’t tell the whole story,” says Joel Berner, senior economist at Realtor.com.
Net operating income captures the routine math of rents coming in and day-to-day bills going out. But it fails to capture mortgage or HELOC payments, or the large and irregular expenses like updates or emergency repairs.
Of course, those numbers represent just one segment of the rental market in one city, but they offer a useful illustration of the pressures facing owners across the country.
The costs of holding housing—debt, repairs, utilities, insurance, and taxes—have all marched steadily upward, even as the ability to pass those costs along (through higher rent or selling) remains constrained by what tenants and buyers can actually afford.
Manage your rentals like a pro.